Abstract
In line with open-source genetics, we report a novel linear regression technique for genome-wide association studies (GWAS), called Open GWAS algoriTHm (OATH). When individual-level data are not available, OATH can not only completely reproduce reported results from an experimental model, but also recover underreported results from other alternative models with a different combination of nuisance parameters using naïve summary statistics (NSS). OATH can also reliably evaluate all reported results in-depth (e.g., p-value variance analysis), as demonstrated for 42 Arabidopsis phenotypes under three magnesium (Mg) conditions. In addition, OATH can be used for consortium-driven genome-wide association meta-analyses (GWAMA), and can greatly improve the flexibility of GWAMA. A prototype of OATH is available in the Genetic Analysis Repository (https://github.com/gc5k/GEAR).
Keywords: GWAS, Arabidopsis, magnesium, transparency, reproducibility, naïve summary statistics, meta-analyses, GWAMA, GEAR
Reproducibility and transparency are the cornerstones of scientific integrity. In addition to artifacts that may compromise a study, analysis itself is becoming more complicated and poses another obstacle to reproducing discoveries. For big data studies involving high-throughput computation, such as GWAS, the reported findings are subject to criticism, as the results may differ among models even when the experimental design is sound. Therefore, the choice of a model as well as its conclusion (i.e., false positive or false negative) are often justified by an analyst’s prior knowledge (Aschard et al. 2015; Day et al. 2016). However, given practical constraints, such as data sharing policies and computational burden, it is not feasible to present all possible results found under alternative models. Although many consortia encourage open-source genetics and have released GWAS summary statistics, including the Genetic Investigation of Anthropometric Traits (GIANT) Consortium and the Psychiatric Genomic Consortia (PGC), it is still difficult to thoroughly evaluate a published study. Consequently, reproducibility and the success rate of subsequent studies are hampered. What kind of method and set of summary statistics are needed to fully reproduce results and to explore studies using unreported analyses?
Statistical analyses can be reproduced in the absence of individual-level data; this is possible due to the theory of sufficient statistics (Fisher 1921). In this study, we propose a complementary method to reproduce each GWAS hit in the absence of shared original data. We report an algorithm called OATH that works directly on summary statistics. When individual-level data are not available, OATH can not only completely reproduce the reported results from an experimental model but also recover underreported results from other alternative models using only summary statistics. The utility of OATH will be demonstrated for 42 phenotypes: 14 traits of 295 Arabidopsis inbred lines grown under three Mg conditions.
Furthermore, as OATH is based on linear regression, its application to other analyses is possible as long as linear regression was employed. For example, OATH can be embedded into consortium-driven GWAMA. Without loss of generality, the literature-driven meta-analyses can be considered a “retrospective” study, which is often an irreversible process under which a meta-analyses conductor can rarely customize the summary statistics. In contrast, a consortium-driven GWAMA can be a “prospective” study; quality control can be conducted more thoroughly (Chen et al. 2017) and the summary statistics from each cohort can be customized under the request of the consortium. As demonstrated below with two Chinese GWAS cohorts, a consortium-driven GWAMA can more efficiently adjust covariates using OATH.
Materials and Methods
We begin this section with a brief explanation of the OATH algorithm; a more detailed description can be found in the Supplemental Material. To demonstrate the use of OATH, an introduction of Arabidopsis GWAS data under Mg treatments and two Chinese GWAS cohorts will follow.
OATH
For a saturated GWAS analysis, its multiple regression model is written as (for the ease of discussion, all variables are centered, but the method can be applied to data not centered)
| (1) |
in which is the observed phenotype of individuals, and is the residual. codes the counts of the reference alleles at the locus and is the covariate. in which is the effect size of the marker and is the partial regression coefficient. The least-squares estimator is in which Both and are individual-level data in the estimator.
The least-squares estimator for can also be expressed in the following form (see Supplemental Material; hereafter referred to as OATH):
| (2) |
in which is the diagonal of in which is for The variance–covariance matrix of is
| (3) |
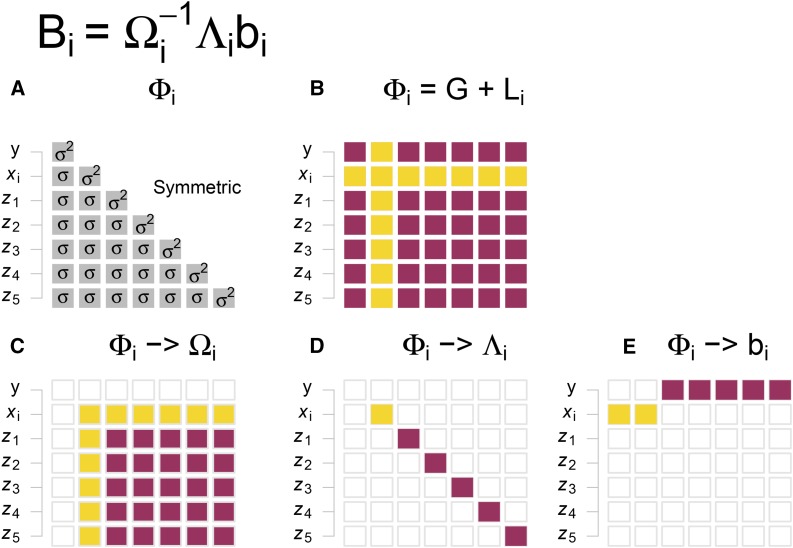
The information [known as sufficient statistics for data reduction (Fisher 1921)] required for Equations 2 and 3 is contained in the variance–covariance matrix of all variables in Equation 1; no individual-level data are needed. As illustrated in Figure 1, all elements for Equations 2 and 3 can be extracted from Rather than summary statistics from complicated models, involves variance and covariance only; therefore, we call them NSS in the text below. Of note, as the second row/column of is locus-specific, only the locus-specific part of should be provided for each locus (Figure 1 and Supplemental Material, File S1).
Figure 1.
Schematic illustration of open GWAS algorithm (OATH). The first row is the OATH equation. The second row shows (A) the sufficient statistics a symmetric matrix, and (B) can be split into generic G (red) and locus-specific (yellow) parts. The third row represents how the elements in can be extracted to build (C) (D) and (E) respectively. GWAS, genome-wide association studies; OATH, Open GWAS algoriTHm.
In general, Equation 2 can be written as indicating the set of covariates included. If any covariates are dropped from Equations 2 and 3 can be tailored to generate a corresponding estimate for the target marker effect Thus, recovering underreported results for any combination of covariates is possible if the summary statistic is provided.
One possible application for OATH is GWAMA. If each cohort sends to the central hub, the whole GWAMA gains more flexibility because the central hub will be able to customize the GWAS model to any combination of covariates. The technical details on how to integrate OATH into GWAMA can be found in File S1.
Arabidopsis GWAS data
The seeds of all 295 lines were acquired from the Arabidopsis Biological Resources Center stock. Then, 234 accessions were sampled from 1307 worldwide accessions, which were genotyped using a 250 K single nucleotide polymorphism (SNP) chip (Horton et al. 2012), and 61 were extracted from the Arabidopsis 1001 Genomes Project (http://1001genomes.org) (Figure S1A in File S2). The geographical distribution of the 295 lines was consistent with the Arabidopsis lines collected in RegPanel (http://regmap.uchicago.edu) (see Figure S1B in File S2). After quality control [triallelic or tetra-allelic loci, minor allele frequency (MAF) < 0.05, genotyping rate < 0.998, and homozygosity rate < 0.99 were removed], 156,744 biallelic loci remained for 42 GWAS (Figure S2 in File S2). Genetic relatedness was estimated using these 156,744 markers, resulting in a genetic relationship matrix (GRM). The eigenvectors were estimated in the GRM.
The 295 inbred lines were grown under three Mg conditions: the low, normal, and high conditions contained 1, 1000, and 10,000 µM MgSO4, respectively, which was in accordance with the concentrations of Mg2+ in soil solutions (Hariadi and Shabala 2004). Fourteen traits were investigated under each treatment: seven were morphological traits and seven were nutrient concentration traits (Table 1). Under the three treatments, there were 42 total phenotypes for each line (Figure S3 in File S2). To reduce environmental influences, the median value of biological replicates was used as the phenotypic value. To reduce the maternal effects prior to phenotyping, inbred lines were grown for one generation under controlled greenhouse conditions at Zhejiang University (N30°18′25, E120°04′54), Hangzhou, Zhejiang Province, China, in 2015. For the ease of analysis, each phenotype was standardized (Figure S4 and Figure S5 in File S2). See the supplementary notes in File S1 for more details on these traits.
Table 1. Fourteen Arabidopsis traits investigated under three magnesium (Mg) treatments.
| Trait Category | Trait Identifier | Full Name of Trait | Unita | Trait Description | Annotation |
|---|---|---|---|---|---|
| MT | RGT | Days to root germination | d | The number of days from seeding until emergence, with more than half of seedlings having a first radicle | Root germination and lateral root number data were shown as the value obtained in low- or high-Mg treatment minus those under normal-Mg treatment. The primary root values for the low-Mg or high-Mg treatment were then divided by values obtained from normal-Mg treatment |
| PRL | Primary root length | cm | After 8 d of growth under the treatments, plants were flattened directly on agar and imaged using a camera | ||
| LRN | Lateral root number | cm | After 8 d growth of under the treatments, plants were flattened directly on agar and imaged using a camera | ||
| SGT | Days to shoot germination | d | Normal | Shoot germination data were shown as the value obtained in low- or high-Mg treatment minus those under normal-Mg treatment. The epicotyl length and rosette width values for low-Mg or high-Mg treatment were then divided by values obtained from normal-Mg treatment | |
| EL | Epicotyl length | cm | After 8 d of growth under the treatments, plants were flattened directly on agar and imaged using a camera | ||
| RL | Rosette width length | cm | After 8 d of growth under the treatments, plants were flattened directly on agar and imaged using a camera | ||
| Biomass | Fresh weight of plants | mg | All fully expanded and nonlesioned seedlings were collected from four plants for each accession and weighed to obtain fresh weight measurements. The results represent average values across all available replicates | Biomass and nutrient concentration data were calculated as the ratio of the treatment value (low Mg or high Mg) divided by the normal, in which seeds were germinated in normal Mg | |
| NCT | K | Potassium concentration per plant | mg/g | Elemental analysis was performed with an ICP-MS (Agilent 7500a). All samples were normalized to calculated weights as previously described. The results represent average values across all available replicates | |
| Ca | Calcium concentration per plant | mg/g | |||
| Mg | Magnesium concentration per plant | mg/g | |||
| S | Sulfur concentration per plant | mg/g | |||
| Fe | Iron concentration per plant | mg/g | |||
| Mn | Manganese concentration per plant | mg/g | |||
| Na | Sodium concentration per plant | mg/g |
MT, morphological traits; NCT nutrition concentration traits; ICP-MS, inductively-coupled plasma mass spectrometry.
For NCT, the units are measured for fresh weight.
Two Chinese GWAS cohorts
Two Chinese GWAS cohorts, NA (Han et al. 2013) and SLE (Han et al. 2009), were used to demonstrate the application of OATH to consortium-driven meta-analyses. The NA cohort was originally recruited for the study of narcolepsy, an autoimmune disorder affecting hypocretin (orexin) neurons; 3191 samples were genotyped. The SLE cohort was recruited for the study of systemic lupus erythematosus in the Chinese population; 2309 samples were genotyped. In order to mimic a consortium-driven GWAMA, these two GWAS cohorts provided the required NSS to the central hub. Using the meta-PCA technique (Chen et al. 2017), the general genotyping quality of these two cohorts was validated by the GWAMA central hub, based only on the reported allele frequencies; individual-level data were not required (Figure S6 in File S2).
Data availability
The authors state that all data necessary for confirming the conclusions presented in the article are represented fully within the article.
Results
An OATH simulation example
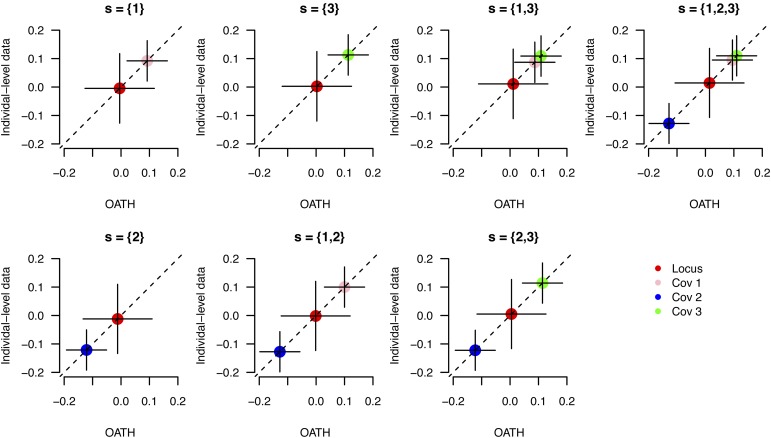
In order to demonstrate the OATH kernel, a single-locus analysis is shown. The MAF of the biallelic locus was 0.23, and the effect size was set to zero. Three covariates, each sampled from the standard normal distribution were simulated. The phenotype was sampled from The sample size was In this simulated sample, and Including one, two, or three covariates, it generated seven possible models. The reproducibility of the partial regression coefficients estimated by OATH agreed well with those estimated from the individual-level data (Figure 2). An R script is available for this example at https://github.com/gc5k/OATH.
Figure 2.
Demonstration of OATH for a single locus. Three covariates were simulated, and OATH generated seven models by including one, two, or three covariates. The subtitle for each plot indicates the set of covariates included. The x-axis represents the regression coefficients estimated from OATH, whereas the y-axis shows the regression coefficients for the corresponding model but estimated from the individual-level data. The vertical and horizontal lines across each point indicate the SE of the partial regression coefficient estimated via OATH and individual-level data, respectively. The subtitle in each panel indicates the covariates included. OATH, Open GWAS algoriTHm.
Two Arabidopsis GWAS models
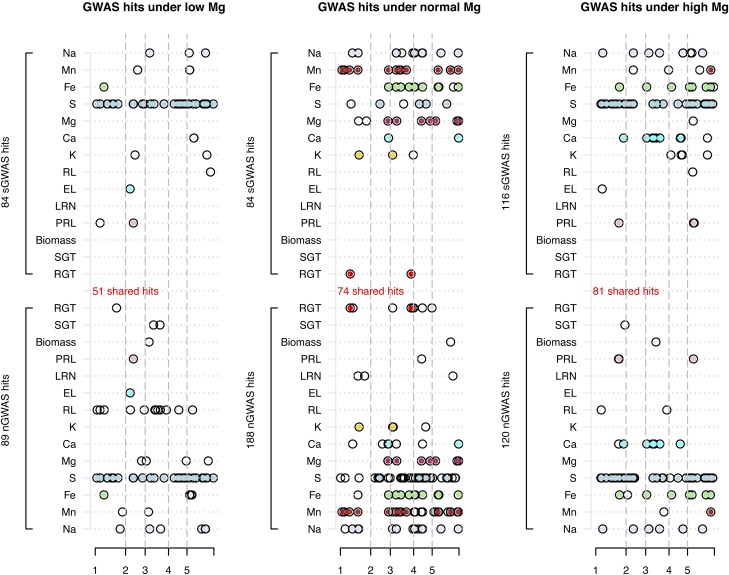
For these 295 Arabidopsis lines, we conducted a GWAS for each of the 42 phenotypes in the saturated GWAS models, which included the top five eigenvectors (Figure S7 in File S2). In contrast, we also conducted naïve/simple linear regressions (i.e., no covariates) for these phenotypes, denoted as naïve GWAS (nGWAS) (Figure S8 in File S2). Under the 42 sGWAS, a metric measuring population stratification (Devlin and Roeder 1999), had a mean of whereas that of the nGWAS was indicating adjustment of the covariates in differentiating GWAS outcomes. For each phenotype, the correlations of the estimated β (additive genetic effect) and between the sGWAS and the nGWAS were and respectively (Figure S9 in File S2). Using as the nominal genome-wide significance threshold, the sGWAS had 284 hits in total; 84, 84, and 116 under the low-, normal-, and high-Mg conditions, respectively. The nGWAS had 397 hits in total; 89, 188, and 120 under the low-, normal-, and high-Mg conditions, respectively. Between the sGWAS and the nGWAS, 206 hits were shared (Figure 3). As demonstrated in this example, an alternative model could lead to different results, which might cause controversy over reproducibility.
Figure 3.
sGWAS and GWAS hits for 14 traits under three Mg conditions. The x-axis shows the chromosomal coordinates for Arabidopsis; the y-axis represents 14 traits. The GWAS hits observed in the saturated model (sGWAS), which was adjusted by the top five eigenvectors, are presented on the top; the hits observed in the naïve model (nGWAS) are represented in the bottom panel. GWAS hits are represented by black circles; and those hits shared by both nGWAS and sGWAS are filled with color. A total of 51, 74, and 81 GWAS hits were shared under low-, normal-, and high-Mg conditions, respectively. A GWAS hit was defined as in which the number of markers was 156,744. GWAS, genome-wide association studies; Mg, magnesium; nGWAS, naïve GWAS; sGWAS, saturated GWAS.
Reproducing sGWAS for Arabidopsis
In order to reproduce the sGWAS results for each SNP in the absence of shared original data, for each phenotype, the following NSS were used: the variance–covariance matrix of a phenotype, five eigenvectors, and information from 156,744 specific loci were also provided. Of note, the covariance matrix of the five eigenvectors was a diagonal matrix because the eigenvectors were mutually orthogonal.
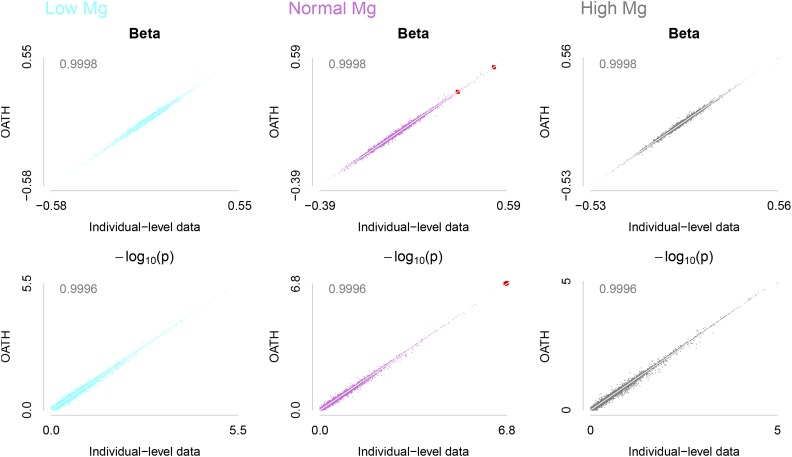
As expected, OATH synthesized the NSS as prepared above to reproduce the 42 sGWAS with high precision, as illustrated for days to root germination (RGT) (Figure 4), as well as for the 41 phenotypes (Figure S10 in File S2). For 14 traits under the normal-Mg condition, the consistency between the estimated β from OATH and those from the sGWAS was and OATH found the same 284 hits that were found in the sGWAS. This indicated that, even without access to the individual-level data, OATH could retrospectively scrutinize the reported results. Furthermore, we also conducted individual-level data GWAS for these 295 Arabidopsis lines by including the top 10 eigenvectors, leading to possible outcomes for the association between a phenotype and a marker. OATH also almost perfectly reproduced the results (data not shown).
Figure 4.
Reproducibility of sGWAS results using OATH with NSS for RTG under three Mg conditions. Each column represents β (top) and p-values (bottom) under low-, normal-, and high-Mg conditions. The y-axis represents the statistics from OATH synthesized from NSS, and the x-axis from the sGWAS; the red points are QTL detected in the sGWAS. Correlations are shown in the top left corner of each panel. GWAS, genome-wide association studies; Mg, magnesium; NSS, naïve summary statistics; OATH, Open GWAS algoriTHm; QTL, quantitative trait loci; RTG, days to root germination; sGWAS, saturated GWAS.
Recovering underreported results for Arabidopsis
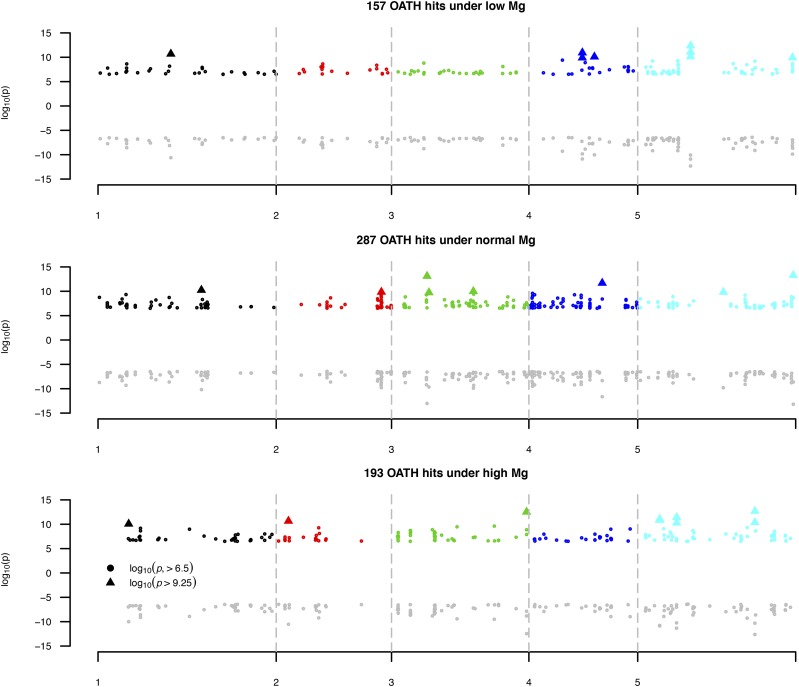
These 295 Arabidopsis lines resulted in the generation of models, given all possible combinations of the five eigenvectors. With the inclusion or exclusion of certain eigenvectors, OATH was capable of synthesizing another 30 GWAS that had at least one of the five eigenvectors as covariates. For each of the 42 phenotypes, an OATH hit was claimed if a SNP had any of its 32 models in which the OATH OATH found 637 hits for 42 phenotypes; 163 hits were not found by either the sGWAS or the nGWAS. Of these 163 new hits, 25 had indicating a nominal overall significance under 42 phenotypes and 32 models. We validated these OATH hits by implementing their exact models using individual-level data from the 295 Arabidopsis lines; the consistency of the β and was and respectively (Figure 5). Therefore, OATH found all possible underreported results with high consistency. These 637 OATH hits were found on 575 unique SNPs, for which 430 were within genes and 145 were between genic regions.
Figure 5.
Validation of OATH hits by their exact models. A total of 637 OATH hits, which had a were found; 25 loci had a Within each panel, the positive part of the y-axis represents the observed in OATH; the negative part of the y-axis is the corresponding evaluated by their exact models using individual-level data from 295 Arabidopsis lines. OATH, Open GWAS algoriTHm.
In-depth evaluation of the GWAS hits for Arabidopsis
In the experimental design theory established by R. Fisher, a single high/low value, such as productivity in a field experiment, is often confounded by a combination of other factors (Fisher 1926) of little interest when compared with the values under different factors. Therefore, we further investigated whether the combination of the eigenvectors influenced each OATH hit.
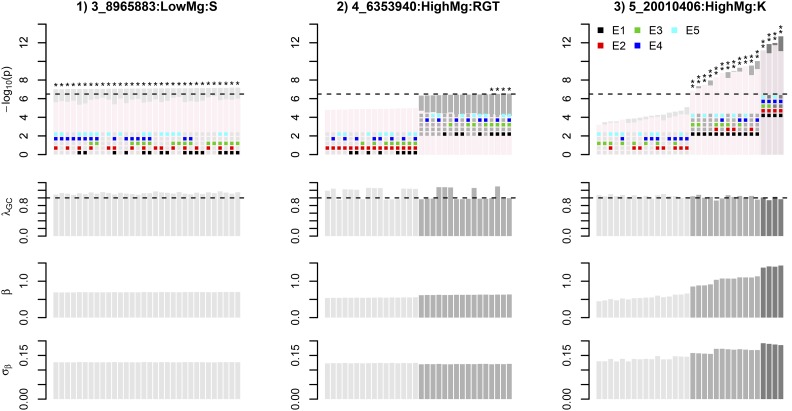
For those 637 OATH hits, the smallest range of 32 from 7.01 to 7.14, was found for SNP 3_8965883 (chromosome 3, 8,965,883 bp, and MAF = 0.0508) associated with sulfur under the low-Mg condition. SNP 3_8965883 was located within RASPBERRY 3 (RSY3), a gene related to embryogenesis (Apuya et al. 2002) (Table 2). Across the 32 models, its βs and SEs remained relatively stable (Figure 6).
Table 2. Three single nucleotide polymorphism (SNP) examples from Arabidopsis inbred lines.
| Conservative Model | Powerful Model | Annotation | ||||||||||||||
|---|---|---|---|---|---|---|---|---|---|---|---|---|---|---|---|---|
| SNP | A1 | Freq. | Covariatesa | Covariates | Treatment | Trait | Group # | F-Statistic | Gene | |||||||
| 3_8965883 | A | 0.0508 | 0.692 | 0.127 | 7.01 | 0.703 | 0.127 | 7.18 | Low Mg | S | 1 | RSY3 | ||||
| 4_6353940 | T | 0.0578 | 0.538 | 0.123 | 4.79 | 0.636 | 0.121 | 6.54 | High Mg | RGT | 2 | 5168 (p < 1e−16) | AT4G10200 | |||
| 5_20010406 | T | 0.0508 | 0.449 | 0.13 | 3.19 | 1.430 | 0.186 | 12.69 | High Mg | K | 3 | 434 (p < 1e−16) | AT5G49350 | |||
Each SNP had 32 models evaluated by Open GWAS algoriTHm (OATH) via naïve summary statistics. The smallest (conservative model) and the largest (powerful) were tabulated. SNP, single nucleotide polymorphism; Freq., frequency; S, sulfur; RGT, days to root germination; K, potassium.
“+” and “−” indicate inclusion and exclusion of the jth covariate.
Figure 6.
Evaluation of the modeling for three OATH hits. The top four rows represent and estimated using 32 possible OATH models given five covariates for these three SNPs. and are in ascending order according to their In the top row, the corresponding OATH models are denoted by colored squares, indicating the inclusion or exclusion of covariates; there are two bars, gray and pink, in each cluster, representing with or without adjustment for An asterisk indicates that this (SNP) is significant under the corresponding model without adjustment for three asterisks indicate that this SNP is significant under the corresponding model, both with and without adjustment for OATH, Open GWAS algoriTHm; SNP, single nucleotide polymorphism.
In contrast, the largest range of from 3.19 to 12.69 (Table 2), was found for SNP 5_200100406 (chromosome 5, 200,100,406 bp, and MAF = 0.058) associated with K under the high-Mg condition. SNP 5_200100406 was located within AT5G49350, a gene encoding glycine-rich protein (Tabata et al. 2000) (Table 2). Of its 32 16 were > 6.5. We partitioned its 32 sorted into different groups if any two neighboring differed by a unit. Its 32 could be split into three groups (F-statistic = 434.06 and p-value < 1e−16). The four OATH models in the highest group included the first, second, and fourth eigenvectors (Figure 6). Its βs were increased in the highest group but the corresponding SEs decreased, resulting in a much higher
In another example, SNP 4_6353940, associated with RGT under the high-Mg condition, had its 32 partitioned into two groups via inclusion or exclusion of the second eigenvector (Figure 6). SNP 4_6353940 had a MAF of 0.0507 and was located within AT4G10200, a gene related to TTF-type zinc finger proteins with a HAT dimerization domain (Mayer et al. 1999) (Table 2). Inclusion or exclusion of the second eigenvector also resulted in two groups for the β. Among 637 OATH hits, this SNP had the most significant difference for its group, and the F-statistic was 5168.142 (p-value < 1e−16).
An R script is available at https://github.com/gc5k/OATH for the demonstrated Arabidopsis analyses with OATH.
Application of OATH to GWAMA
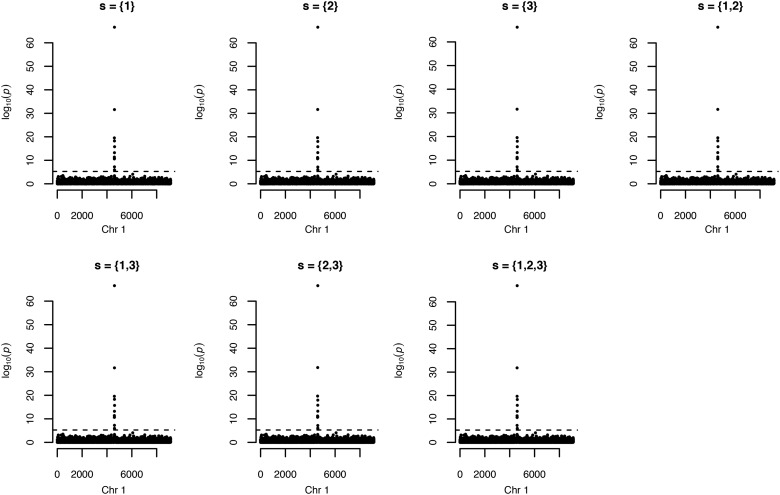
Two Chinese GWAS datasets, the NA (Han et al. 2013) and SLE cohorts (Han et al. 2009), were used to confirm the utility of OATH for meta-analyses. From these two cohorts, 9124 common variants on chromosome 1 in both cohorts were analyzed in NA (3191 samples) and SLE (2309 samples), respectively. For both cohorts, the SNPs were aligned on the same reference alleles. SNP rs4144542 was set as the causal locus explaining 5% of the total phenotypic variation. Three eigenvectors were used as covariates. In order to mimic a real consortium-driven GWAMA, one author (HFZ) generated NSS for these two GWAS cohorts; another author (GBC), who was blind to the individual-level data, ran OATH and the meta-analyses. After receiving the central hub synthesized seven corresponding given consequently, meta-analyses could be implemented for each locus. As demonstrated in Figure 7, rs4144542 was successfully identified in all seven GWAMA analyses. Other loci had very similar estimated effects under these seven models.
Figure 7.
Genome-wide association meta-analyses (GWAMA) of the NA and SLE cohorts. The subtitle in each panel indicates a customized GWAMA. For example, indicates that the first and third eigenvectors are covariates for each of the two cohorts. The dashed line indicates the chromosome-wise threshold, given
An R script is available for this GWAMA demonstration at https://github.com/gc5k/OATH.
Discussion
The scientific community is seeking reproducibility, and efforts have been made to improve reproducibility as well as transparency. Reproducibility may vary among studies; however, false discovery due to controversial or improper modeling can be monitored and even avoided, as demonstrated for the 295 Arabidopsis lines. Since the establishment of experimental design theory for field experiments (Fisher 1926), it has been known that a single outcome may be confounded, such as nutrition level factors. A high or low outcome makes little sense when it departs from its context, such as the conditions that led to the observed extreme values. In particular, as justification for the inclusion of covariates is controversial, variation in studies due to modeling makes reproducibility challenging (Aschard et al. 2015). As GWAS results are often reported using a particular model, the interpretation of a GWAS hit should be reasonably scrutinized, as demonstrated in this study.
We developed OATH and demonstrated its utility in GWAS of 295 Arabidopsis inbred lines. OATH successfully reproduced the GWAS results generated from a model with five covariates. In addition, underreported results, possibly generated by alternative models, were recovered. Given these comprehensive results, we could evaluate GWAS hits more thoroughly. As OATH is based on summary statistics, this implementation was compatible with GWAS data sharing policy, including those involving human subjects. For Arabidopsis, a typical admixed population, a linear mixed model technique provides an alternative solution (Korte et al. 2012); however, the complicated statistical properties of linear mixed models (Chen 2014, 2016; de los Campos et al. 2015) may be beyond OATH’s linear regression model capabilities.
Given the many possible ways to utilize OATH, GWAMA would most likely benefit from OATH integration. Using OATH, GWAMA would be more efficient at switching from one GWAS model to another whenever necessary, a procedure that often leads to logistical burden under a conventional GWAMA design. Many consortia that encourage open-source genetics have released GWAS summary statistics, such as GIANT and PGC. If those consortia would also release the naïve summary data required by OATH, efficiency and reproducibility can be dramatically boosted and the utility of the GWAS data maximized because the recovery of underreported GWAS discoveries becomes possible, as demonstrated in our study.
In summary, in line with the open-source movement, we believe that reproducibility, transparency, and in-depth evaluation of GWAS are possible or can be improved using the proposed method. OATH as a solution is simple and easily embedded into other applications, and the information technology seems mature enough for implementation. To facilitate application of the proposed method, we deposited OATH in Genetic Analysis Repository (GEAR; https://github.com/gc5k/GEAR). Three “one-click-for-all” R scripts for the demonstrated examples are available at https://github.com/gc5k/OATH.
Supplementary Material
Supplemental material is available online at www.g3journal.org/lookup/suppl/doi:10.1534/g3.116.038877/-/DC1.
Acknowledgments
We thank the associate editor and two reviewers for constructive comments that significantly improved the quality of the manuscript. This work was supported by the Natural Science Foundation of China (31601277 to Y.-F.N.; 81402762 to C.Y.; 81601105 to J.H.; and 81501145 to H.-F.Z.), ninth special grants for postdoctoral research (2016T90156 to Y.-F.N.), the China Postdoctoral Science Foundation (2014M551754 and 2015M581216 to Y.-F.N.), and the Zhejiang Provincial Natural Science Foundation for Distinguished Young Scholars of China (LR17H070001 to H.-F.Z.). We thank Hangzhou Guhe Information and Technology Co., Ltd., for bioinformatics assistance. The authors declare no competing financial interests.
Author contributions: G.-B.C. and Y.-F.N. conceived and designed the study. G.-B.C. developed the theory, performed the Arabidopsis GWAS analysis, GWAMA, and developed GEAR::OATH. Y.-F.N. performed the material collection and Arabidopsis experimental operations, wrote the protocol for the material growth, and conducted phenotype analysis. F.H. and H.-F.Z. cleaned and provided the naïve summary statistics of the NA and SLE cohorts. C.Y. prepared the R scripts for demonstration. G.-B.C. and Y.-F.N. wrote the manuscript. J.H. and L.-B.G. contributed to the improving of the study and manuscript.
Footnotes
Communicating editor: G. A. de los Campos
Literature Cited
- Apuya N. R., Yadegari R., Fischer R. L., Harada J. H., Goldberg R. B., 2002. RASPBERRY3 gene encodes a novel protein important for embryo development. Plant Physiol. 129: 691–705. [DOI] [PMC free article] [PubMed] [Google Scholar]
- Aschard H., Vilhjalmsson B. J., Joshi A. D., Price A. L., Kraft P., 2015. Adjusting for heritable covariates can bias effect estimates in genome-wide association studies. Am. J. Hum. Genet. 96: 329–339. [DOI] [PMC free article] [PubMed] [Google Scholar]
- Chen G.-B., 2014. Estimating heritability of complex traits from genome-wide association studies using IBS-based Haseman–Elston regression. Front. Genet. 5: 107. [DOI] [PMC free article] [PubMed] [Google Scholar]
- Chen G.-B., 2016. On the reconciliation of missing heritability for GWAS data. Eur. J. Hum. Genet. 24: 1810–1816. [DOI] [PMC free article] [PubMed] [Google Scholar]
- Chen G.-B., Lee S. H., Robinson M. R., Trzaskowski M., Zhu Z., et al. , 2017. Across-cohort QC analyses of GWAS summary statistics from complex traits. Eur. J. Hum. Genet. 25: 137–146. [DOI] [PMC free article] [PubMed] [Google Scholar]
- Day F. R., Loh P. R., Scott R. A., Ong K. K., Perry J. R. B., 2016. A robust example of collider bias in a genetic association study. Am. J. Hum. Genet. 98: 392–393. [DOI] [PMC free article] [PubMed] [Google Scholar]
- de los Campos G., Sorensen D., Gianola D., 2015. Genomic heritability: what is it? PLoS Genet. 11: e1005048. [DOI] [PMC free article] [PubMed] [Google Scholar]
- Devlin B., Roeder K., 1999. Genomic control for association studies. Biometrics 55: 997–1004. [DOI] [PubMed] [Google Scholar]
- Fisher R. A., 1921. On the mathematical foundations of theoretical statistics. Philos. Trans. R. Soc. Lond. 222: 309–368. [Google Scholar]
- Fisher R. A., 1926. The arrangement of field experiments. J. Minist. Agric. Gt. Britain 33: 503–513. [Google Scholar]
- Han F., Faraco J., Dong X. S., Ollila H. M., Lin L., et al. , 2013. Genome wide analysis of narcolepsy in China implicates novel immune loci and reveals changes in association prior to vs. after the 2009 H1N1 influenza pandemic. PLoS Genet. 9: e1003880. [DOI] [PMC free article] [PubMed] [Google Scholar]
- Han J.-W., Zheng H.-F., Cui Y., Sun L.-D., Ye D.-Q., et al. , 2009. Genome-wide association study in a Chinese Han population identifies nine new susceptibility loci for systemic lupus erythematosus. Nat. Genet. 41: 1234–1237. [DOI] [PubMed] [Google Scholar]
- Hariadi Y., Shabala S., 2004. Screening broad beans (Vicia faba) for magnesium deficiency. II. Photosynthetic performance and leaf bioelectrical responses. Funct. Plant Biol. 31: 539–539. [DOI] [PubMed] [Google Scholar]
- Horton M. W., Hancock A. M., Huang Y. S., Toomajian C., Atwell S., et al. , 2012. Genome-wide patterns of genetic variation in worldwide Arabidopsis thaliana accessions from the RegMap panel. Nat. Genet. 44: 212–216. [DOI] [PMC free article] [PubMed] [Google Scholar]
- Korte A., Vilhjálmsson B. J., Segura V., Platt A., Long Q., et al. , 2012. A mixed-model approach for genome-wide association studies of correlated traits in structured populations. Nat. Genet. 44: 1066–1071. [DOI] [PMC free article] [PubMed] [Google Scholar]
- Mayer K., Schüller C., Wambutt R., Murphy G., Volckaert G., et al. , 1999. Sequence and analysis of chromosome 4 of the plant Arabidopsis thaliana. Nature 402: 769–777. [DOI] [PubMed] [Google Scholar]
- Tabata S., Kaneko T., Nakamura Y., Kotani H., Kato T., et al. , 2000. Sequence and analysis of chromosome 5 of the plant Arabidopsis thaliana. Nature 408: 823–826. [DOI] [PubMed] [Google Scholar]
Associated Data
This section collects any data citations, data availability statements, or supplementary materials included in this article.
Supplementary Materials
Data Availability Statement
The authors state that all data necessary for confirming the conclusions presented in the article are represented fully within the article.


