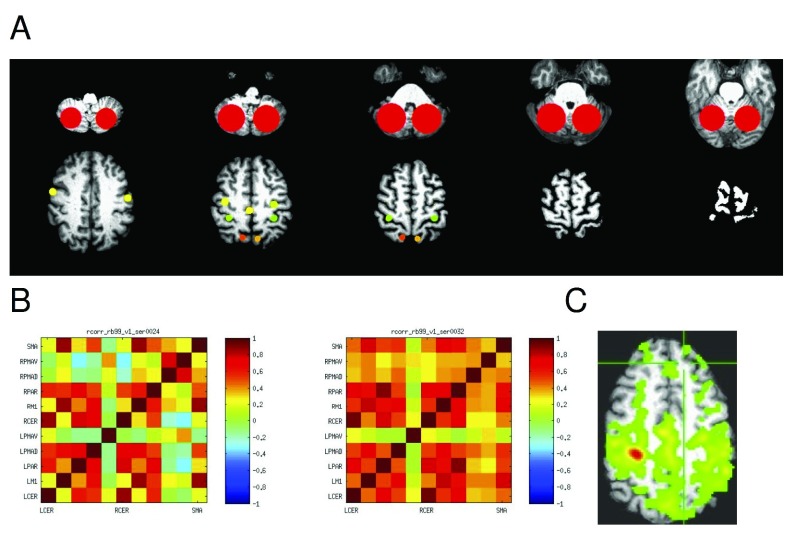
Figure 2. Resting state connectivity (correlations).
A: The 11 regions of interest (ROIs) are shown on representative axial slices of an example brain MRI. The top slices show the cerebellar ROI, then the PMAv on the left bottom slice, and PMAd, M1, and superior parietal regions from anterior to posterior. The SMA is represented by a single midline ROI. B. Correlation matrix with correlations at baseline in two resting states scans in the same participant. C. Example correlation in a single slice with a affected side M1 ROI as the seed.

