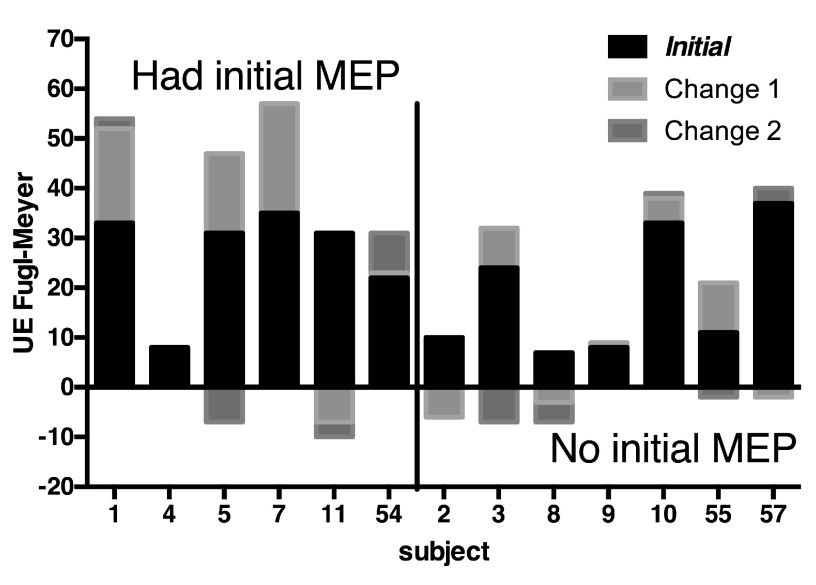
Figure 3. Clinical Outcomes.
The baseline and change in Fugl-Meyer score are shown for each participant, grouped by whether there was initial motor evoked potential as measured by TMS. Change 1 is across the intervention; Change 2 is between the end of the intervention and the last outcome measurement (12 weeks). Negative changes are always shown below the baseline.

