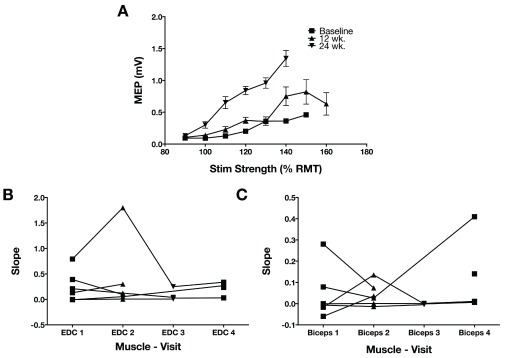
Figure 4. Recruitment curves on the affected upper extremity.
A. Single participant (#1) recruitment curves in the EDC and the second baseline and two follow-up measurements. Stimulation strength is indicated on the x-axis as a percentage of resting motor threshold. B. The slope of the recruitment curve between 100 and 120% of resting motor threshold stimulation strength was extracted from each recruitment curve of each participant that had measurable recruitment curves that could be measured on the affected side EDC. The first two measurements are both baseline periods. Changes in the recruitment curve slope were not significant. C. Recruitment curve slope in biceps (otherwise, as in B).

