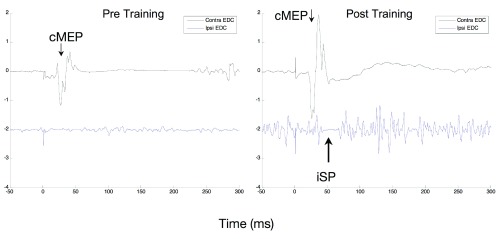
Figure 5. Ipsilateral Silent Period.
An example of ipsilateral silent period measured at baseline (left) and immediately after the 12 weeks intervention (right) in participant RB5. EMG is measured in mV in the EDC muscle contralateral to the TMS stimulator in the upper trace and ipsilateral in the lower trace, which is offset by 2 mV. Before the intervention there is little activation of the muscle and also no apparent silent period. There is much more activation of the muscle after the intervention and also a visible short ipsilateral silent period.

