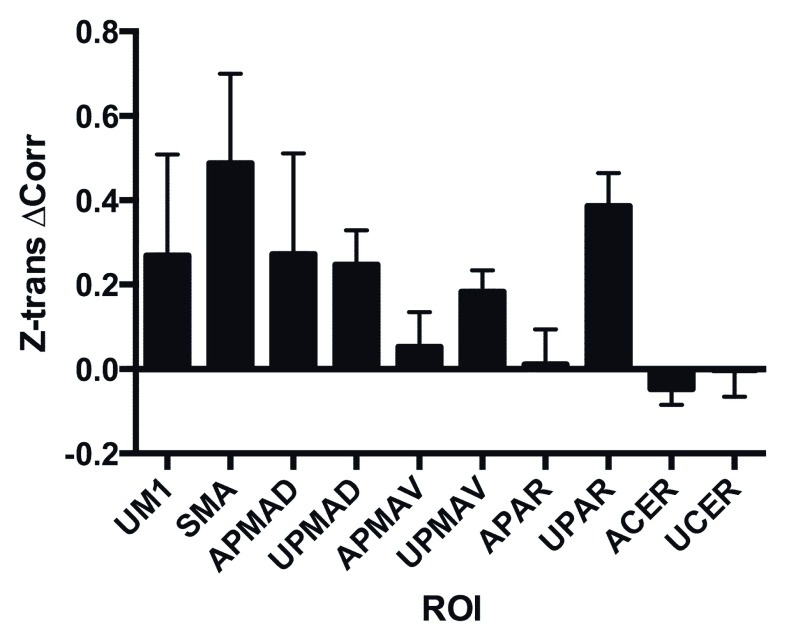
Figure 6. Change in connectivity of AM1.
The mean change and S.D. of the Z-transformed correlation coefficient of the affected primary motor cortex (AM1) with each of the other regions is shown. Note that all regions showed an increase in connectivity except the parietal regions. Region names include ‘A’ for affected side hemisphere (the side opposite to the affected hemisphere in the case of the cerebellum, ‘CER’) and ‘U’ for unaffected, with region names as in Figure 2.

