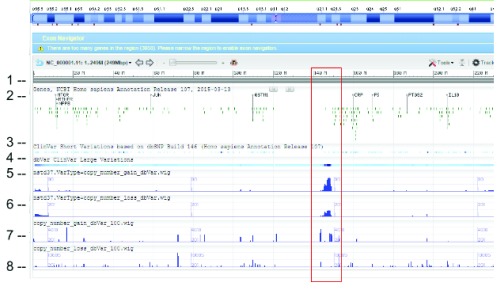
Figure 3. SVC (type=CNV) distribution on chromosome 1 as seen on NCBI Variation Viewer (Variation Viewer - NCBI).
Starting from the top: (1) chr 1 sequence, (2) Gene track, (3) ClinVar short variation for dbSNP SNV, (4) ClinVar large variation, (5) ClinGen SVC study-set (dbVar:nstd37) copy number gain, (6) ClinGen SVC study-set (dbVar:nstd37) copy number loss, (7) SVC combined-set for copy number gain with count >= 100, and (8) SVC combined-set for copy number loss with count >= 100. The red box highlights an SVC hotspot region found in ClinGen (dbVar:nstd37) tracks 5 and 6 that correspond with the variants in ClinVar. The scale for SVC count histogram are 1–90 (track 5), 1–20 (track 6), 1–4618 (track 7), and 1–10885 (track 8).

