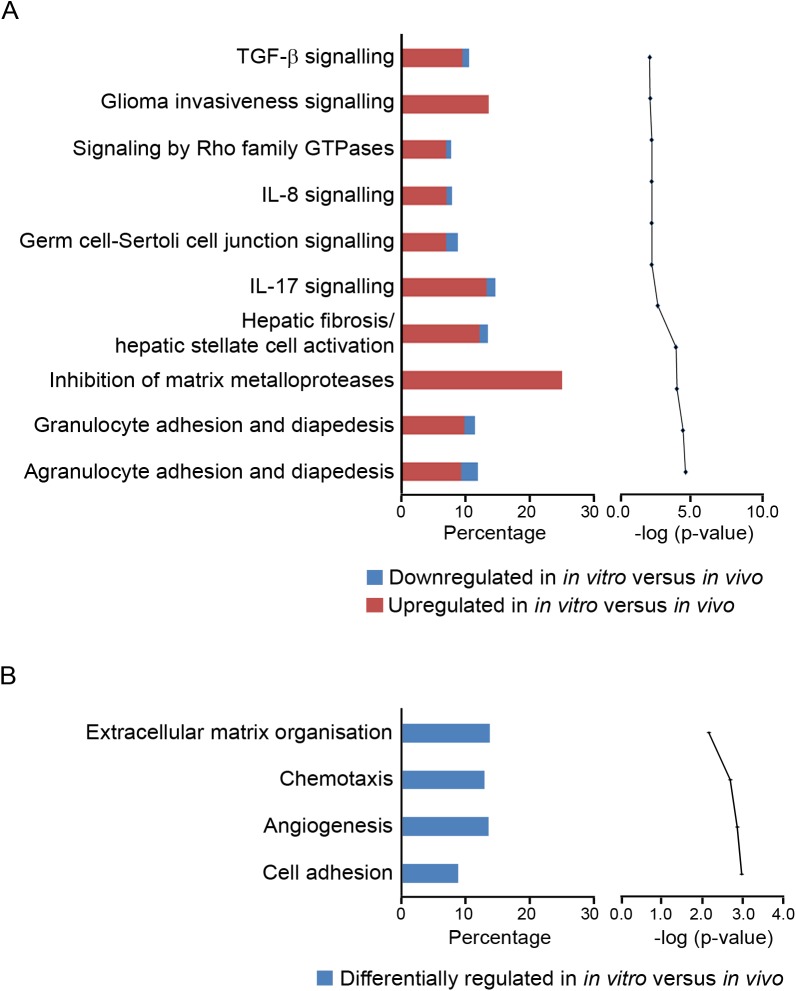
Fig 3.
Top canonical pathways in granulosa cells mapped in IPA (A) and GO terms (B) classified under biological process. In (A) the bar chart on the left represents the percentage of genes from the data set that map to each canonical pathway showing those which are up regulated (in red) and down regulated (in blue) in vitro with respect to in vivo. The line chart on the right ranks these pathways derived for the same data set, from the highest to lowest degree of association based on multiple correction testing for the Benjamini-Hochberg False Discovery Rate. In (B) the bar chart on the left represents the percentage of genes from the data set that map to each GO term showing those which are differentially regulated (in blue) in vitro with respect to in vivo. The line chart on the right ranks these pathways derived for the same data set, from the highest to lowest degree of association using the Benjamini-Yuketeli test for multiple corrections (bottom to top in graphs on right).

