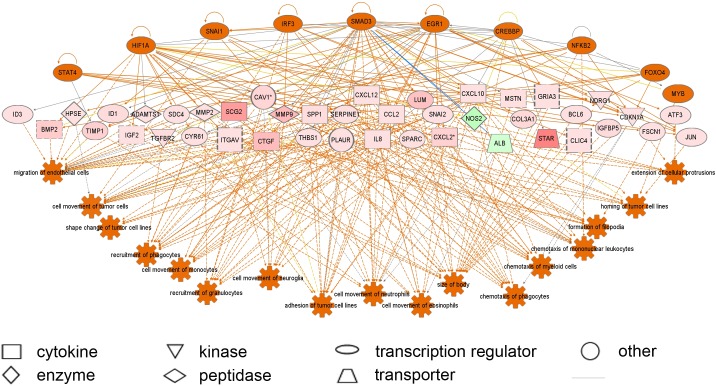
Fig 6. Regulator effect network analysis in IPA identifying altered regulators and networks in thecal cells cultured in vitro.
Orange and blue are predicted up and down regulated regulators on top, and the pink and green represent up and down regulated genes from the array data with the intensity of colour reflecting the degree of change. The pathways altered are listed at the bottom and orange indicates they are up regulated in vitro.

