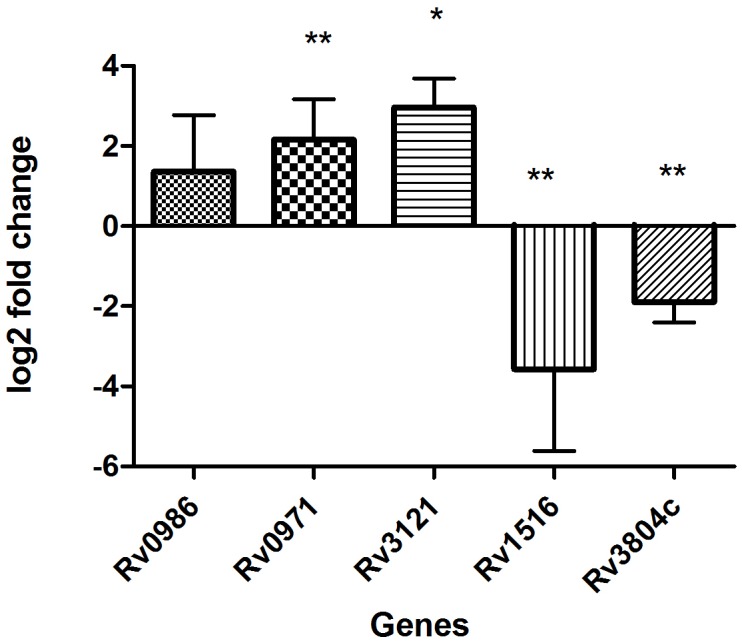
Fig 3. Validation of microarray data on real time PCR by analyzing the relative expression of 5 genes in smear positive PTB samples as compared to in vitro grown M.tb H37Rv.

16s rRNA was used as reference gene for normalization. Y-axis values (Log2 fold change) of ≥1 indicate upregulation and values ≤ -1 indicate down-regulation. Each bar represents mean ± SD values for each of the genes with three technical replicates. *p<0.05; **p<0.01 by student’s t test.
