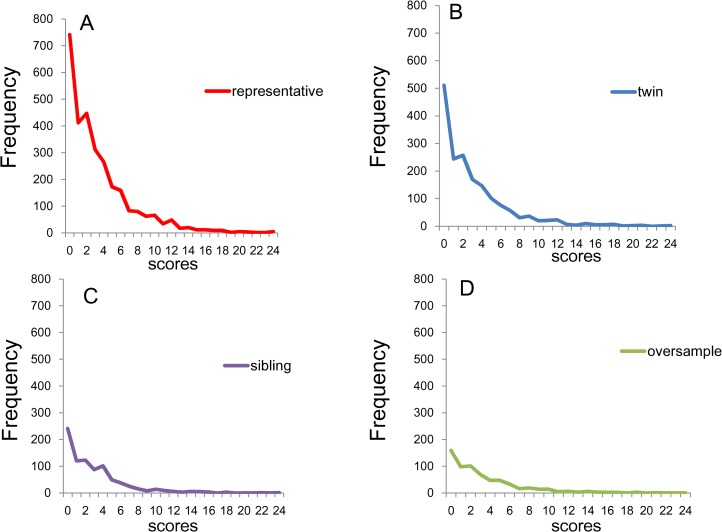
Figure 2. Distributions of K6 total scores.
(A) National RDD sample (n = 2,975) , (B) national RDD sample of twin pairs (n = 1,743), (C) siblings of individuals from the RDD sample (n = 858), and (D) oversamples from five metropolitan areas in the US (n = 647). While the distributions of the K6 total scores for the four groups are commonly right-skewed, the frequencies of the zero score differed across groups.

