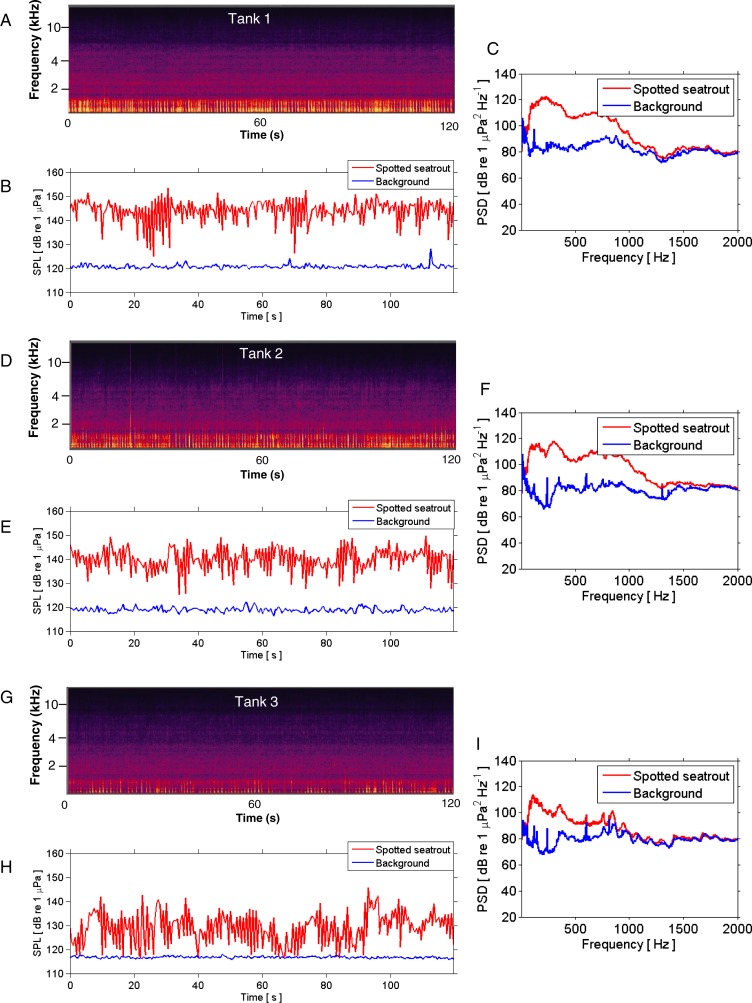
Figure 3. SPL and PSD comparisons between background and spotted seatrout choruses.
Representative spectrograms (A, D, G), instantaneous sound pressure levels (B, E, H), and power spectral density calculations (C, F, I) of an entire 2 min wav file for each tank during an evening in which male spotted seat trout called and females spawned. Tank 1 = 2,680,000 eggs were collected the next morning; Tank 2 = 7,110,000 eggs; and Tank 3 = 2,580,000 eggs. The sample rate was 50 kHz. The spectrograms were created using Adobe Audition with a spectral resolution of 2,048 and time duration of 120 s. Brighter colors correspond to fish calling and higher sound pressure levels. Instantaneous SPLs and PSDs in this figure were calculated between 1 and 2,000 Hz using a FFT size of 50,000 samples, which corresponded to a frequency resolution of 1 Hz. Corresponding background SPLs and PSDs for each tank were performed on 2 min wav files in which calling was not detected. These background noise files were selected as closely in time as possible to the represented fish choruses.

