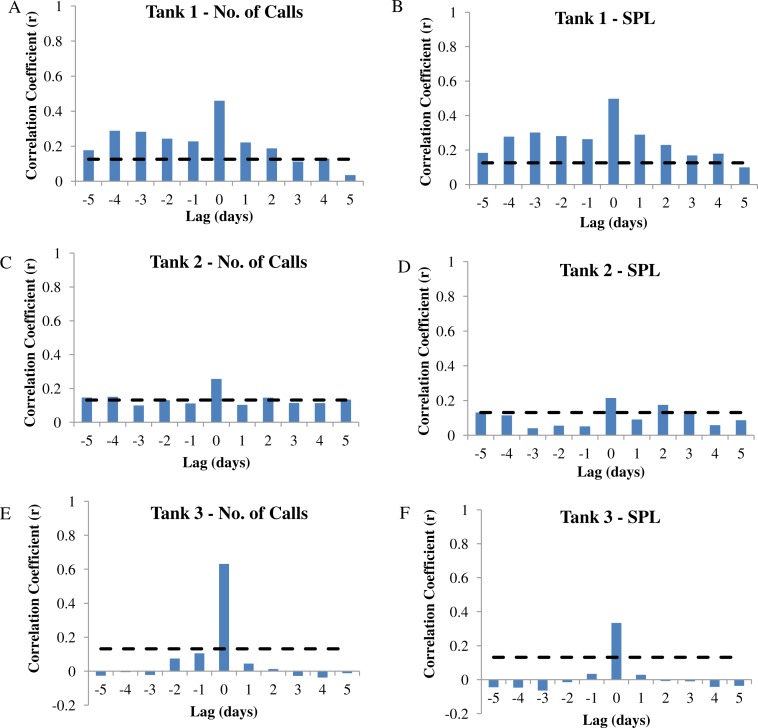
Figure 7. Autocorrelation analysis.
Autocorrelation analysis was used to determine the correlation between calling variables (i.e., number of calls and sound pressure level or SPL) and eggs collected at −5 to +5 day lags in wild caught spotted seatrout (Cynoscion nebulosus) held in captivity. (A) Tank 1 –number of calls, (B) Tank 1 –SPL, (C) Tank 2 –number of calls, (D) Tank 2 –SPL, (E) Tank 3 –number of calls, (F) Tank 3 –SPL. The dotted lines represent the 95% confidence interval.

