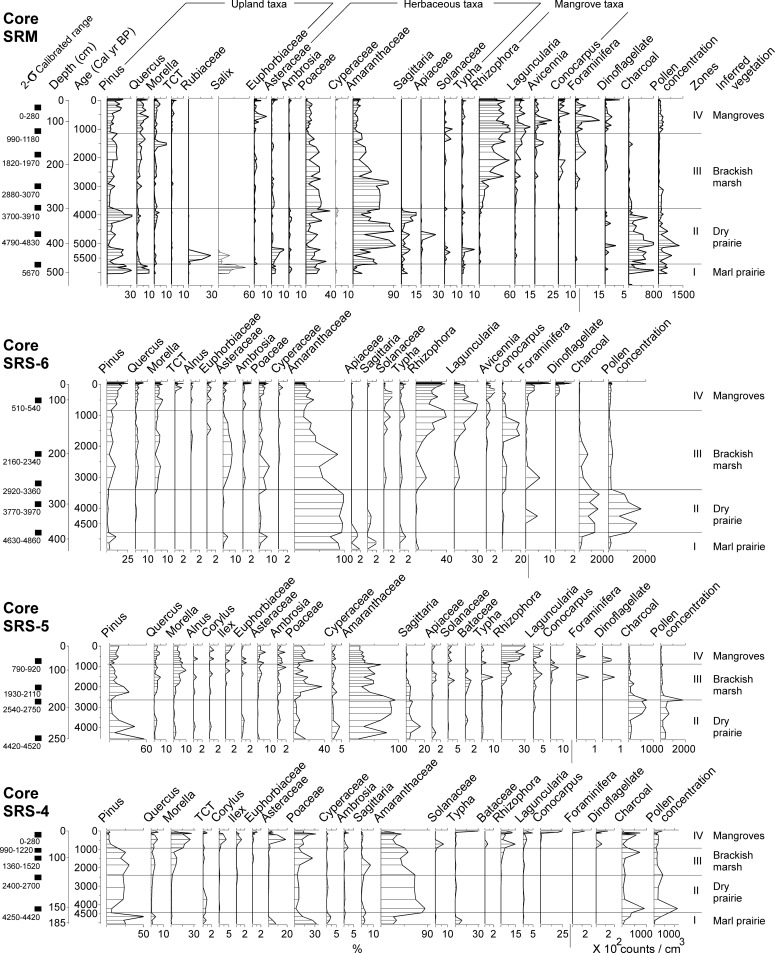
Fig 4. Pollen percentage diagrams for core SRM, SRS-6, SRS-5, and SRS-4 plotted against calibrated age (cal yr BP).
The 2-σ calibrated range of accepted 14C dates are listed at the left side of each core at corresponding depths. The concentration curves for marine planktons, charcoal fragments, and total pollen are added on the right to facilitate comparison.

