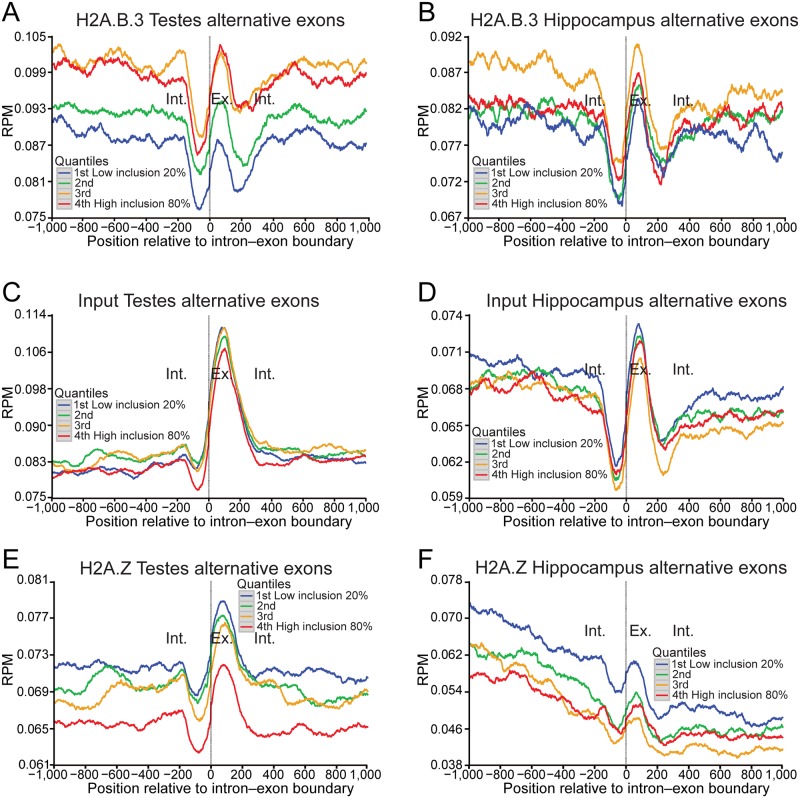
Fig 3. The incorporation of H2A.B.3 at alternatively spliced exons is positively correlated with the level of inclusion.
(a) Normalised testis H2A.B.3 ChIP-Seq reads aligned with the intron—exon boundary ranked according to the level of inclusion of alternatively spliced exons (very low, 20%; low, 40%; medium, 60%; and high, 80%). (b) Normalised hippocampus H2A.B.3 ChIP-Seq reads aligned with the intron—exon boundary ranked according to the level of inclusion of alternatively spliced exons. (c) Normalised testis input reads aligned with the intron—exon boundary ranked according to the level of inclusion of alternatively spliced exons. (d) Normalised hippocampus input reads aligned with the intron—exon boundary ranked according to the level of inclusion of alternatively spliced exons. (e) Normalised testis H2A.Z ChIP-Seq reads aligned with the intron—exon boundary ranked according to the level of inclusion of alternatively spliced exons. (f) Normalised hippocampus H2A.Z ChIP-Seq reads aligned with the intron—exon boundary ranked according to the level of inclusion of alternatively spliced exons.

