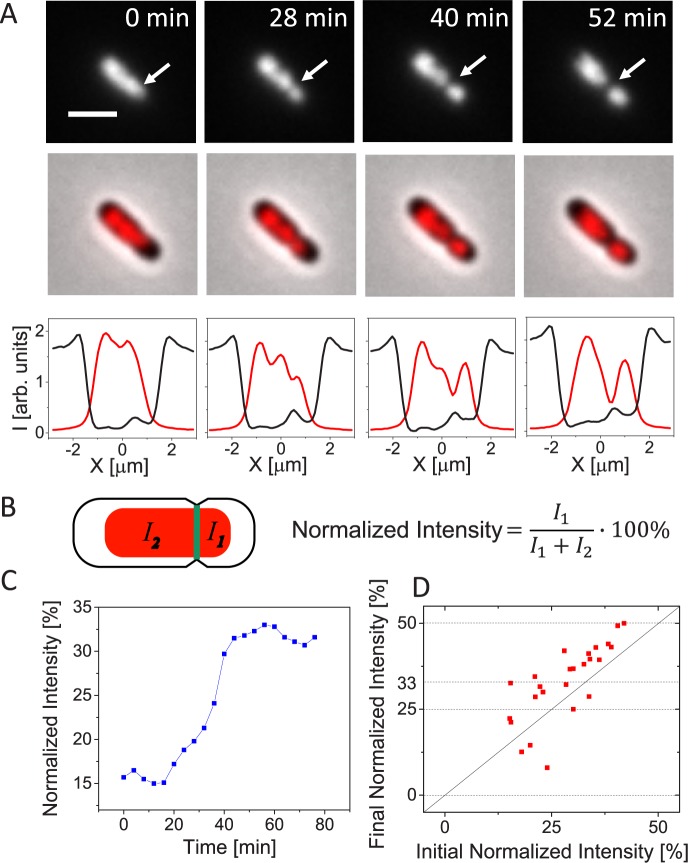
Fig 1. Chromosomal movement across the septum in asymmetrically dividing ΔslmA ΔminC ΔzapB cells.
A: Time-lapse images showing HupA-mCherry labelled chromosomes (top row) and overlay of HupA-mCherry and phase images in an asymmetrically dividing cell (middle row). Bottom row shows intensity line profiles along the long axes of this cell. The black line is for phase and red for the HupA-mCherry profile. Time zero corresponds to the appearance of constrictions in phase images. Arrows in top row of images point to location of cell division plane. Strain JM30. Scale bar is 2 μm. B: Schematics showing calculation of normalized intensity. I1 and I2 are the integrated fluorescent intensities of the nucleoid label on the smaller and larger daughter side of the cell division plane, respectively. C: Normalized intensity from HupA-mCherry label during cell division for the cell shown in panel A. D: Initial normalized intensity at the time when constriction appears vs. final normalized intensity at the time when cells divide for 25 cells. Horizontal dotted lines show expected final normalized intensity values. Solid diagonal line marks no change in normalized intensity during division.

