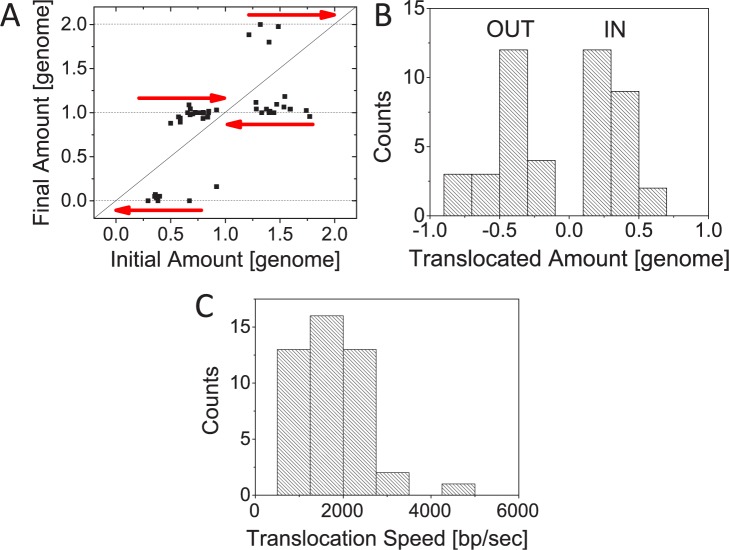
Fig 5. Quantification of DNA movement during translocation.
A: Estimated amount of DNA in the smaller daughter compartment in the beginning and end of translocation. The amount of DNA is given in genome units (4.6 Mb). Arrows pointing to the right indicate divisions in which the DNA amount in the smaller daughter cell increases and arrows pointing to the left are those where the amount decreases. No change in DNA amount is marked by solid diagonal line. B: Distribution of the DNA amount that has crossed the division plane during translocation. DNA amounts are given in genome units. Positive amounts correspond to DNA moving into the smaller daughter compartment and negative amounts moving out from it. C: Distribution of translocation speeds. N = 46 for all the panels. Data from strains JM30 and MB16 is combined.

