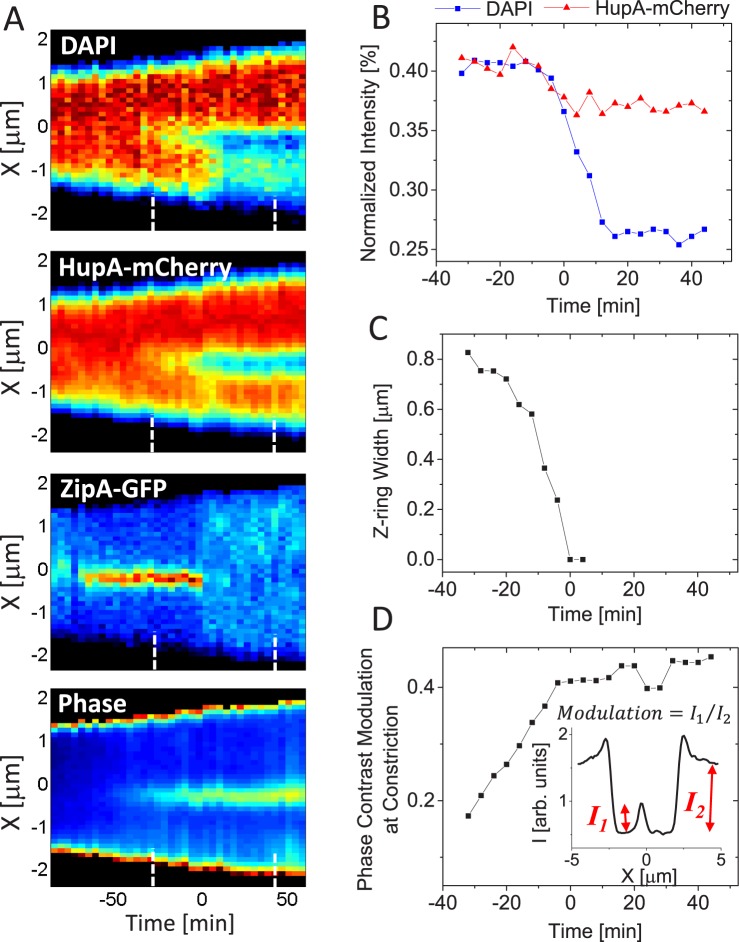
Fig 6. Determination of translocation timing based on Z-ring and phase contrast images.
A: Kymographs of DAPI, HupA-mCherry, ZipA-GFP labels and phase contrast images along the long axes of a representative cell. Red corresponds to high and blue to low intensity. Black areas are outside the cell. Time zero corresponds to the first frame when no ZipA-GFP accumulation is present at the constriction. Dashed lines in the bottom of every kymograph show the time interval corresponding to traces in panels B-D. Strain MB16. B: Normalized intensity from DAPI and HupA-mCherry labels as a function of time for the same cell. C: Width of the Z-ring as a function of time. The width is measured along the short axes of the cell. D: Modulation of phase contrast images at the constriction as a function of time. The inset shows determination of the modulation from phase contrast profiles along the long axes of the cell.

