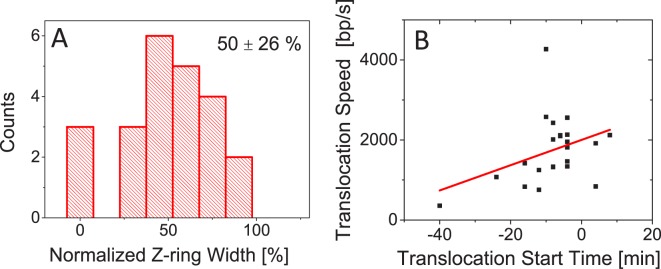
Fig 8. Correlations between translocation timing, width of the constriction, and translocation speed.
A: Normalized width of the Z-ring when translocation initiates. For normalization, the width of unconstricted Z-ring is used. Mean and std of the distribution are shown. Strain MB16. N = 24. B: Translocation start time vs. translocation speed. Solid line is a linear fit (y = 32 x+2000; R = 0.37).

