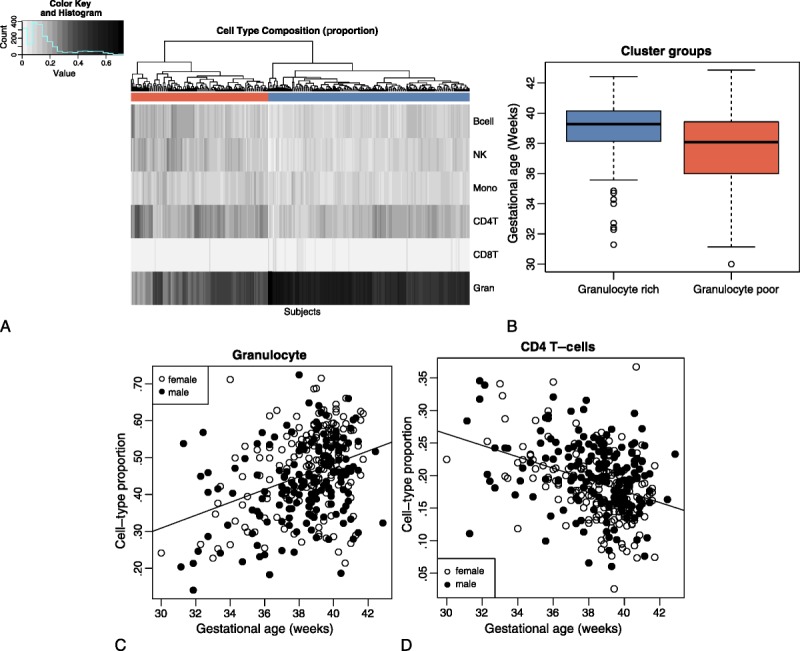
FIGURE 1.

Differences in cell type proportions in cord blood are associated with gestational age. (A) Heatmap of blood cell type proportions estimated from DNAm for 341 neonate cord blood samples. Hierarchical clustering is based on blood cell type proportions; colors under the tree are used to indicate clustering of subjects into two groups (corresponding to granulocyte rich vs. granulocyte poor samples). (B) Gestational age distribution of subject clusters determined by blood cell type proportions (granulocyte rich or granulocyte poor). Granulocyte rich samples (blue) are predominantly full term; granulocyte poor samples (red) are predominantly preterm. (C) Proportion of granulocytes by gestational age. Marker types indicate subject gender, indicating no significant difference in proportion due to gender. (D) Proportion of CD4 T cell by gestational age. Marker types indicate subject gender, indicating no significant difference in proportion due to gender.
