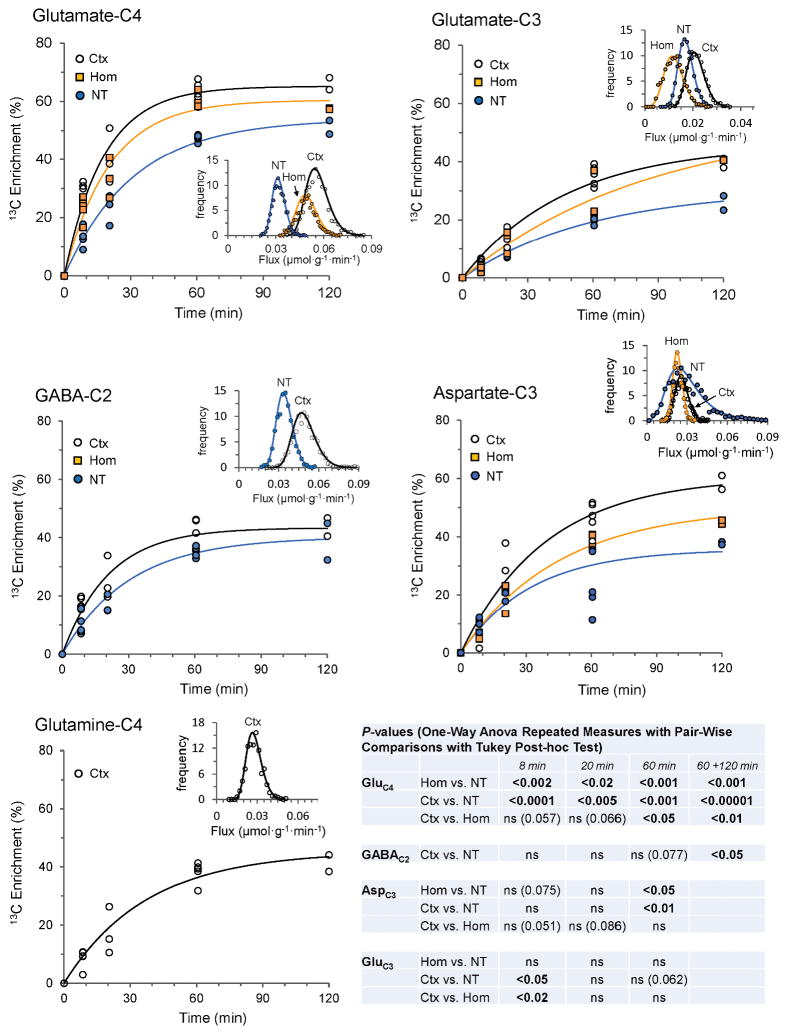
Fig. 2.
Ex vivo time courses of 13C enrichment of amino acids in cerebral cortex (Ctx), homogenate (Hom) and nerve terminals (NT) in anesthetized rats receiving timed intravenous infusion of [1,6-13C2]glucose. Lines reflect best fit of a single exponential function to each data set consisting of 13-to-15 animals. Uncertainty distributions of the fitted rate constants (insets) for each turnover curve were assessed by Monte-Carlo simulation with 1000 iterations using the CWave software. P-values were determined from the distributions of the rate constants (see Table 1). Statistical significance of between-group differences in 13C enrichments at the different time points was assessed by One-Way Repeated Measures ANOVA and Tukey’s Test. The 120 min time point consisted of too few animals (N=2) for statistical analysis and this data was combined (60 min + 120 min). The 13C enrichment data from animals infused for 8 min and 60 minutes were taken from Patel et al. [48].

