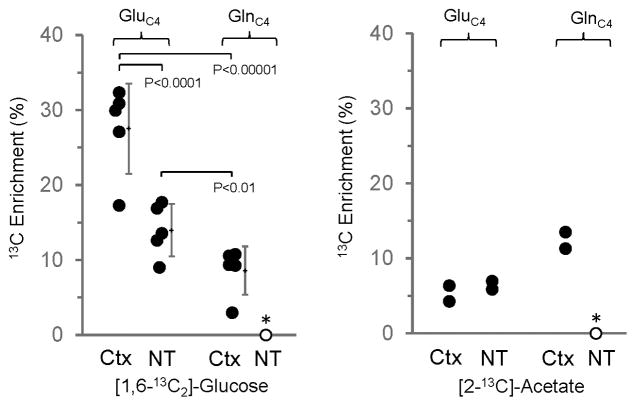
Fig. 3.
Comparison of 13C enrichment of glutamate-C4 and glutamine-C4 in cerebral cortex (Ctx) and nerve terminals (NT) following intravenous infusion of either [1,6-13C2]glucose for 8 min (left panel, n=5) or [2-13C]acetate for 15 min (right panel, n=2). For the glucose-infusion data, mean ± SD is shown to the right of each data set. Data points were separated slightly (horizontal scale) to improve clarity. P-values determined by One-Way ANOVA for Repeated Measures and Tukey’s test. The symbols represent values of individual measurements. (*) Glutamine-C4 was below the level of detection in the nerve terminals.

