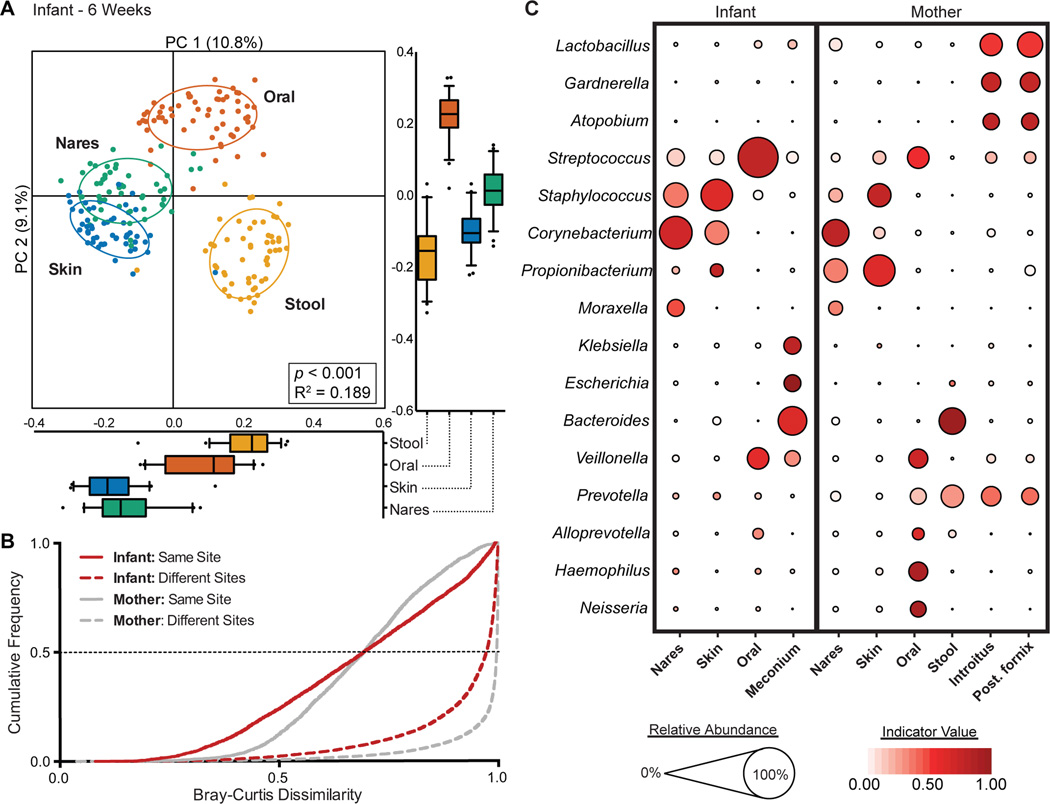
Fig. 2. The infant microbiota at 6 weeks demonstrates body site specificity.
(A) PCoA on unweighted UniFrac distances between the infant microbiota is shown along the first two PC axes. Boxplots shown along each PC axis represents the distribution of samples along the given axis, representing the median and interquartile range with whiskers determined by Tukey’s method. Each point represents a single sample and is colored by body site: Stool, orange; Skin, blue; Oral cavity, red; Nares, green. Ellipses represent a 95% confidence interval around the cluster centroid. Clustering significance by virtue of body site was determined by Adonis (p<0.001). (B) Cumulative distribution of Bray-Curtis dissimilarity distances calculated pairwise between samples of the same body site (solid lines), and between different body sites (dashed lines). Distance comparisons for infant and maternal samples are shown in red and gray, respectively. Smaller values indicate a greater similarity between samples. (C) The average relative abundance (circle size) of the most prevalent genera (y-axis) in each body site (x-axis) is plotted for infants and mothers at 6 weeks. The indicator value index (related to circle shade darkness) represents the strength of association between a taxa and a given body site, with larger values indicating greater specificity.

