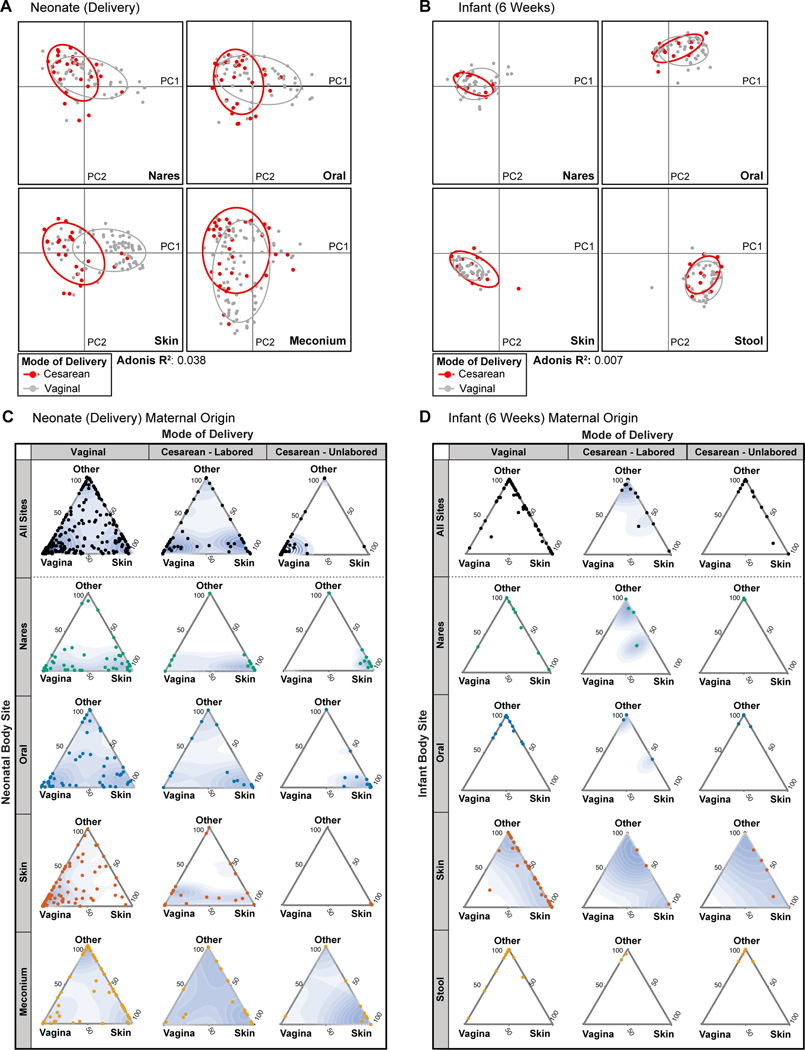
Fig. 3. Failure to demonstrate a significant impact of mode of delivery on the infant microbiota across body sites and time.
(A and B) PCoA on unweighted UniFrac distances between the neonatal microbiota at delivery (A) and 6 weeks (B). Data are stratified by body site, with mode of delivery indicated by color (Cesarean, red; vaginal, gray). Ellipses represent the 95% confidence interval around the cluster centroid. Significance of clustering, which was seen among neonatal (A, delivery) nasal, oral, and skin communities, but not meconium (Mann-Whitney test of PC1 values: p>0.05), was determined by an Adonis test by virtue of mode of delivery, stratified by body site (R2=0.038). Conversely, among infants (B,6 weeks), significant clustering was not observed (Adonis p=0.057, R2=0.007). (C and D) Three axes ternary plots indicating the proportion of OTUs within a neonatal sample (each point) predicted to originate from a maternal body site (indicated by the triangle vertices). Each point represents a neonatal sample while its position indicates the predicted relative contribution from either the maternal vagina (posterior fornix or introitus), maternal skin (retroauricular crease or antecubital fossa) or from another maternal site (supragingival plaque, anterior nares, stool, unknown). Points closer to the vertices indicate that a greater proportion of the samples OTUs are predicted to originate from the microbiota of the indicated maternal body site. Data for samples obtained at delivery (C) and at 6 weeks (D) are stratified by body site and by mode of delivery (Vaginal, Cesarean-Labored, or Cesarean-Unlabored). A 2D point density topography map (blue shading) for each plot is given to indicate the point density.

