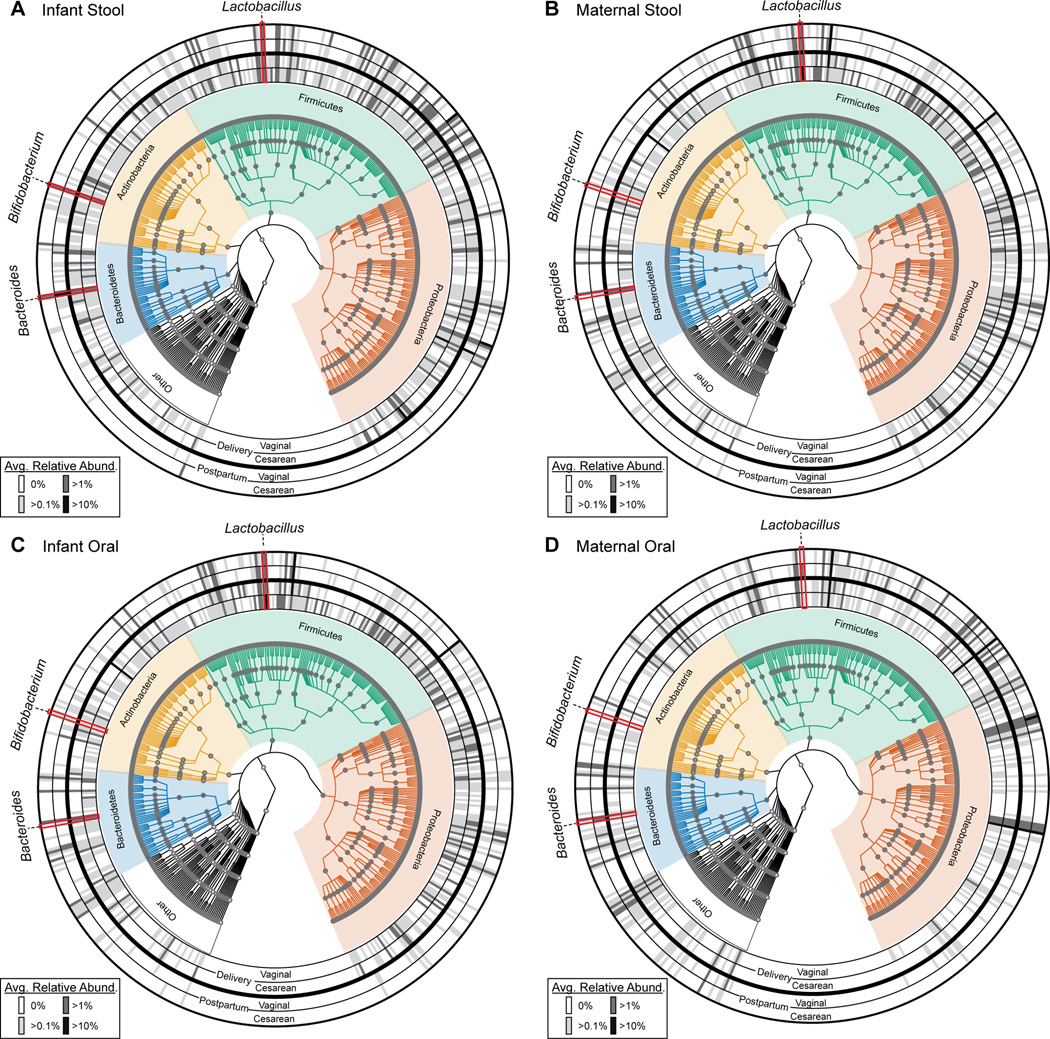
Fig. 4. Taxonomic profiles of infant and maternal stool and oral microbiomes according to mode of delivery and time.
A phylogenetic representation of the taxonomic composition in the infant stool (A), maternal stool (B), infant oral (C), and maternal oral (D) samples at delivery (inner two rings) and 6 weeks postpartum (outer two rings). Each time point is further divided by mode of delivery (indicated by the label at the bottom of the rings. The average relative abundance of each genera are plotted within the concentric rings, represented by the shaded cells, with higher relative abundance indicated by a darker shade. The phyla to which each taxa belongs is indicated by the phylogenetic tree. Three notable taxa are indicated by the red outline, namely Bacteroides, Bifidobacterium and Lactobacillus.

