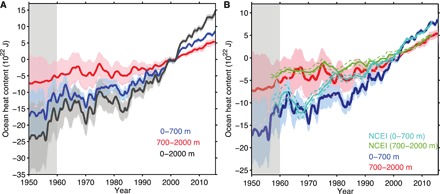
Fig. 4. Global OHC change time series.

(A) OHC from 0 to 700 m (blue), 700 to 2000 m (red), and 0 to 2000 m (dark gray) from 1955 to 2015 as obtained by this study, with the uncertainty of the ±2σ interval shown in shading. All time series of the new analysis are smoothed by a 12-month running mean filter, relative to the 1997–2005 base period. (B) The new estimate is compared with an independent estimate from NCEI with its SE as dashed lines. Both OHC 0 to 700 m and OHC 700 to 2000 m are shown from 1957 to 2014. The baseline of the time series from NCEI is adjusted to the values of the current analysis within 2005–2014.
