. 2017 Jan 16;6:e21615. doi: 10.7554/eLife.21615

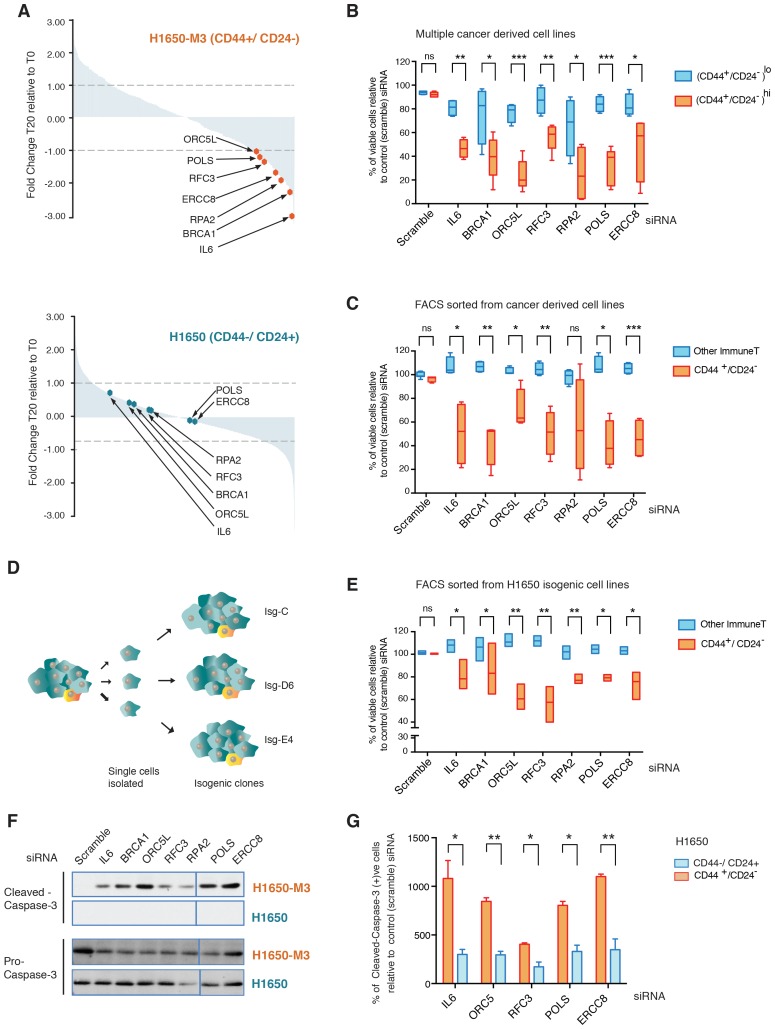
Figure 1. A genome-wide shRNA screen identifies genes involved in DNA damage repair (DDR) that are required for the survival of CD44+/CD24−.

(A) The graph depicts the relative abundance of barcodes recovered from the screen. Each bar represents fold changes of an shRNA expression vector at T20 (i.e., 20 cell passages) compared with T0 (time of infection) in CD44+/CD24− H1650-M3 cells (upper panel) and CD44−/CD24+ H1650 cells (lower panel). Dots indicate unique genes, knockdown of which conferred proliferative disadvantage to CD44+/CD24− (H1650-M3) cells. The data are plotted as the means of three biological replicates in ascending order. A FACS profiling of H1650-M3 and H1650 cells, along with a schematic of the shRNA screen, is provided in Figure 1—figure supplement 1. (B) Validation of shRNA screen hits in tumor-derived cell lines characterized by low CD44+/CD24− cell content (i.e., MCF7, A549 and BT474) compared to cell lines with high CD44+/CD24− content (i.e., NCI-H23, PC9, MDA-MB435S and MDA-MB-231). The box plots show the percentage of viable cells 5 days after transfection with the indicated siRNAs relative to the number of control scramble-siRNA transfected cells. Each box is the mean ± SD of data collected from cell lines with either (CD44+/CD24−)lo or (CD44+/CD24−)hi content, from two independent experiments, each conducted in eight replicates (p-value *<0.05, **<0.005, ***<0.0005, unpaired t-test). FACS profiles for each cell line, relative % of viable cells for each cell line and knockdown efficiency are reported in Figure 1—figure supplement 2. (C) Validation of shRNA screen hits in tumor-derived cell lines FACS-sorted on the basis of the surface expression of CD44 and CD24. The box plots show the percentage of CD44+/CD24− cells and cells of other immune types upon transfection with the indicated siRNA oligonucleotides relative to control (scramble) siRNA. Each box is the mean ± SD of data collected from four cells lines (A549, H1650, PC9 and NCI-H23) upon FACS sorting, each from three replicates from two independent experiments. (p-value *<0.05, **<0.005, ***<0.0005, unpaired t-test). See Figure 1—figure supplement 3 for more details. (D) Schematic of the generation of single cell-derived isogenic cell lines from H1650 cells. See Figure 1—figure supplement 4A for CD44 and CD24 surface marker staining profiles. (E) Validation of shRNA screen hits in the FACS-sorted H1650 single cell-derived isogenic clones—Isg-C, Isg-D6 and Isg-E4. The box plots indicate the percentage of CD44+/CD24− cells and cells of other immune types after transfection with the indicated siRNA oligonucleotides relative to control (scramble) siRNA. Each box is the mean ± SD of data collected from three different isogenic cell lines, each from three replicates from two independent experiments (p-value *<0.05, **<0.005, unpaired t-test). See Figure 1—figure supplement 4B,C for further details. (F) Expression of Pro-caspase three and Cleaved-caspase 3 (i.e., cell death marker) in H1650-M3 (CD44+/ CD24−) and H1650 (CD44−/CD24+) cell lines upon knockdown of indicated gene expression. Samples were collected 3 days post-transfection and protein lysates were immune-blotted with the indicated antibodies. Alpha-tubulin is used as the loading control. See Figure 1—figure supplement 5 for quantification. (G) Percentage of Cleaved-caspase 3-positive cells, normalized to respective scramble controls (set at 100%), in FACS-sorted CD44+/CD24− and CD44−/CD44+ cells in H1650 cell line. Each bar represents mean ± SD of three replicates from two independent experiments(p-value *<0.05, **<0.005, unpaired t-test).

DOI: http://dx.doi.org/10.7554/eLife.21615.003

Figure 1.

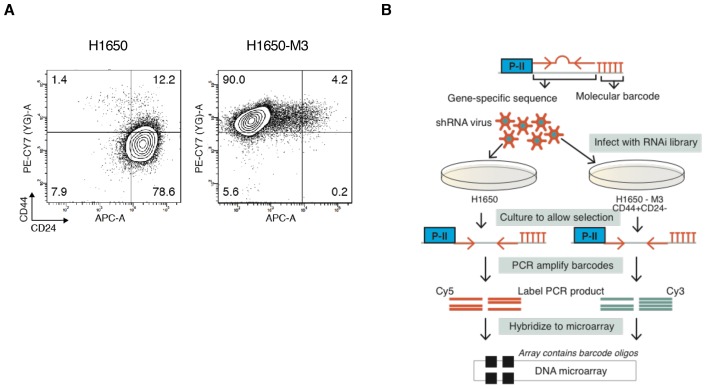
Figure 1—figure supplement 1. Forward genetic screen performed in H1650 and H1650-M3 cell lines.

Figure 1—figure supplement 1.

(A) FACS analysis of H1650 and H1650-M3 stained with antibodies against cell surface markers CD44 and CD24. (B) A schematic of the RNAi-based, forward genetic screen.
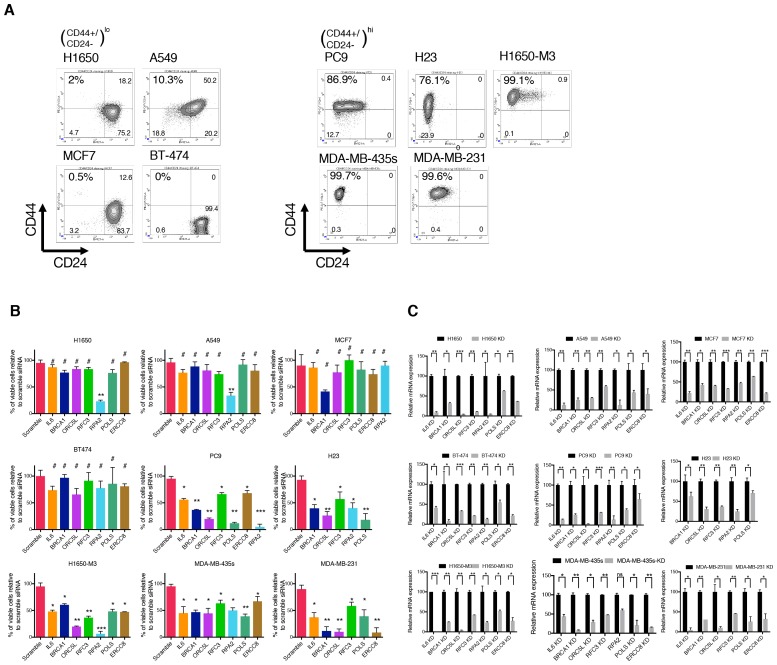
Figure 1—figure supplement 2. Validation of shRNA screen hits in tumor-derived cell lines characterized by low (H1650, A549, MCF7, and BT-474) and high (PC9, NCI-H23, H1650-M3, MDA-MB-435s and MDA-MB-231) content of CD44+/CD24− cells.

Figure 1—figure supplement 2.

(A) FACS profile of multiple cancer-derived cell lines used in validation of the shRNA screen hits. Cells were stained with antibodies against cell surface markers CD44 and CD24 and analyzed with FACS. (B) The charts represent the percentage of viable cells 5 days after transfection with the indicated siRNA oligonucleotides compared to scramble siRNA=transfected control cells. Each bar represents mean ± SD of two independent experiments each conducted in eight- replicates (n = 16). (C) Efficiency of knockdown upon transfection with the indicated siRNA oligonucleotides and compared to scramble siRNA transfected control cells. Cells were collected 3 days post transfection and analyzed for expression of the indicated mRNA by RT-qPCR. Each bar represents mean ± SD of three replicates. p-value *<0.05, **<0.005, ***<0.0005, unpaired t-test. Non-significant differences are shown by the symbol ‘#’ or ‘ns’.
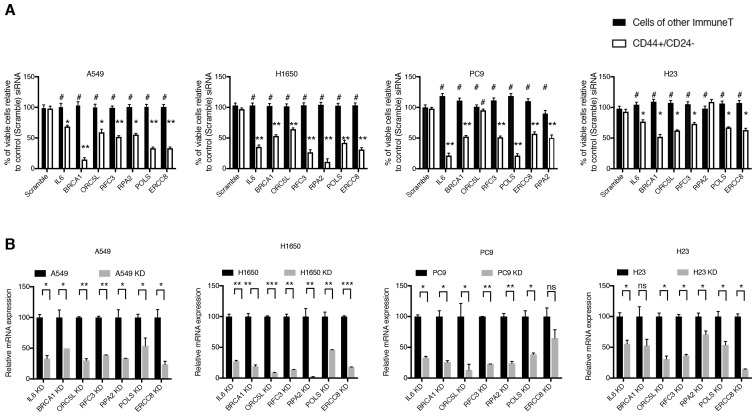
Figure 1—figure supplement 3. Validation of shRNA screen hits in tumor-derived cell lines FACS sorted on the basis of the surface expression of CD44 and CD24.

Figure 1—figure supplement 3.

( A) The charts represent the percentage of viable CD44+/CD24− cells and cells of other immune types upon transfection with the indicated siRNA oligonucleotides relative to control (scramble siRNA). Each bar represents mean ± SD of three technical replicates from two independent experiments. 10,000 cells were analyzed by FACS for each replicate of each sample. (B) Efficiency of knockdown upon transfection with the indicated siRNA oligonucleotides and compared to control cells transfected with scramble siRNA. Cells were collected 3 days post transfection and analyzed for expression of the indicated mRNA. Each bar represents mean ± SD of three replicates. p-value *<0.05, **<0.005, ***<0.0005, unpaired t-test. Non-significant differences are shown by the symbol ‘#’ or ‘ns’.
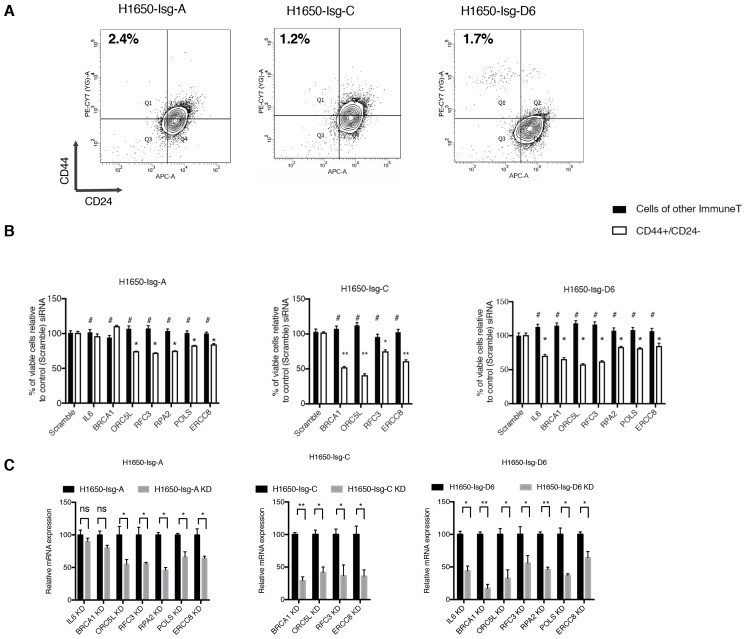
Figure 1—figure supplement 4. Validation of shRNA screen hits in H1650-derived isogenic clones, FACS sorted on the basis of surface expression of CD44 and CD24.

Figure 1—figure supplement 4.

(A) FACS profile of H1650-derived isogenic cell lines stained with CD44 and CD24 antibodies. The numbers in bold represent the percentage of cells that are CD44+/CD24−. (B) The charts represent the percentage of viable CD44+/ CD24− cells and cells of other immune types upon transfection with the indicated siRNA oligonucleotides relative to control (scramble siRNA). Each bar represents mean ± SD of three technical replicates from two independent experiments. 10,000 cells were analyzed by FACS for each replicate of each sample. (C) Efficiency of knockdown upon transfection with the indicated siRNA oligonucleotides and compared to scramble siRNA transfected control cells. Cells were collected 3 days post transfection and analyzed for expression of the indicated mRNA. Each bar represents mean ± SD of three replicates. p-value *<0.05, **<0.005, ***<0.0005, unpaired t-test. Non-significant differences are shown by the symbol ‘#’ or ‘ns’.
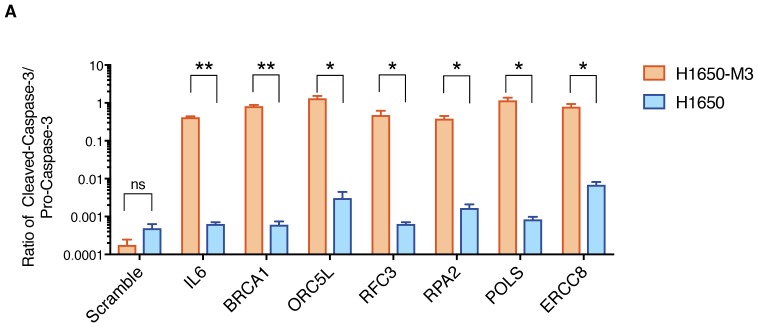
Figure 1—figure supplement 5. Quantification of apoptosis-mediated increase in lethality in H1650-M3 and H1650.

Figure 1—figure supplement 5.

The chart depicts quantification of relative amounts of Cleaved-caspase-3 between H1650-M3 and H1650 from the immunoblots indicated in Figure 1F. Levels of intensity of each band were quantified using imajeJ32 software and is represented as a ratio to Pro-Caspase-3. The data represent mean ± SD from two independent experiments. p-value *<0.05, **<0.005, unpaired t-test.
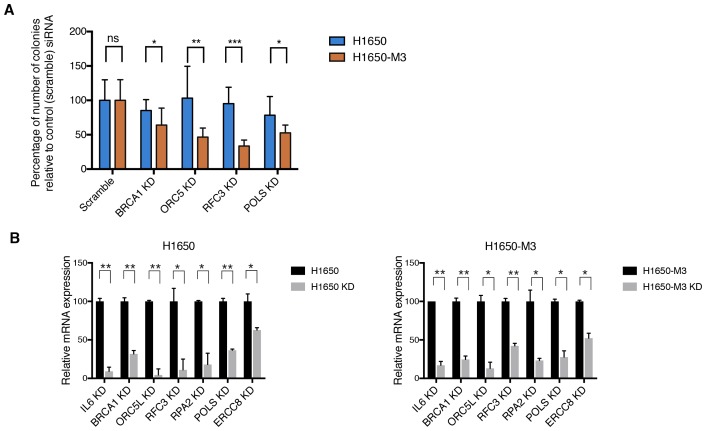
Figure 1—figure supplement 6. Validation of shRNA screen hits in H1650 and H1650-M3 cells using the clonogenic assay technique.

Figure 1—figure supplement 6.

(A) Clonogenic assay performed on H1650 and H1650-M3 to validate siRNA screen hits for BRCA1, ORC5L, RFC3, and POLS. The charts represent the percentage of viable cells 15 days after transfection with the indicated siRNA oligonucleotides compared to that of scramble-siRNA-transfected control cells. Each bar represents mean ± SD of data collected from ten fields from three different six-well plates (n = 30). (B) Knockdown efficiency for clonogenic assay upon transfection with the indicated siRNA oligonucleotides. Samples were collected 3 days post-transfection and analyzed by immunoblot analysis with antibodies against Total caspase 3, alpha-tubulin and Cleaved-caspase 3. Each bar represents mean ± SD of three replicates. p-value *<0.05, **<0.005, ***<0.0005, unpaired t-test. Non-significant differences are shown by the symbol ‘#’ or ‘ns’.