. 2017 Jan 16;6:e21615. doi: 10.7554/eLife.21615

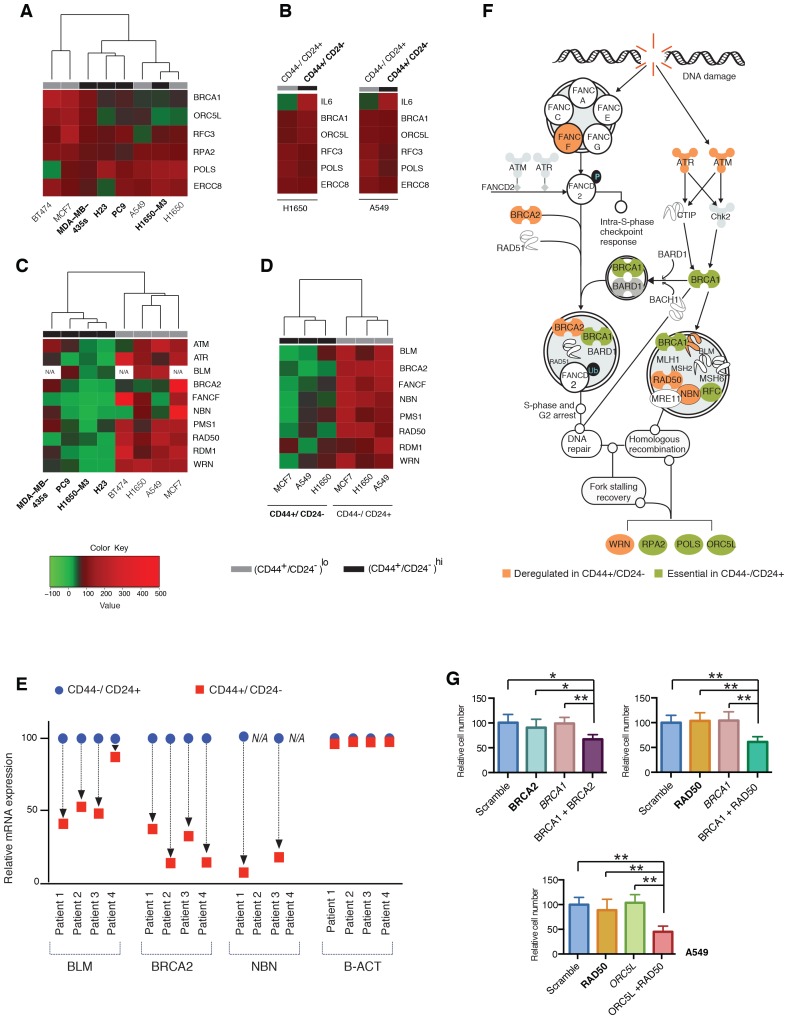
Figure 2. Decreased expression of homology-directed repair (HDR) genes in CD44+/CD24− cells results in synthetic lethal interactions.

(A) The heat map represents a hierarchical cluster analysis of BRCA1, ORC5L, RFC3, RPA2, POLS and ERCC8 mRNA expression in the indicated tumor-derived cell lines and (B) in H1650 and A549 cells that were FACS sorted on the basis of their surface expression of CD44 and CD24. mRNA expression was quantified by SYBR-green-based RT-qPCR. Cell lines with high CD44+/CD24− cell content are indicated in bold. The data represent mean ± SD of three replicates from two independent experiments. See Figure 2—figure supplement 1 for details. (C) Hierarchical cluster analysis of the mRNA expression of the indicated HDR genes in multiple tumor-derived cell lines with high (indicated in bold) or low content of CD44+/CD24− cells. mRNA expression was quantified by SYBR-green-based RT-qPCR. The data represent the mean ± SD of three replicates from two independent experiments. See Figure 2—figure supplement 2 for details. (D) Clustering analysis of mRNA expression of the HDR genes in CD44+/CD24− and CD44−/CD24+ cells FACS-sorted from H1650, A549 and MCF7 cells. mRNA expression was quantified by SYBR-green-based RT-qPCR. The data represent the mean ± SD of three replicates from two independent experiments. See Figure 2—figure supplement 3A for details. (E) Expression of BLM, BRCA2 and NBN genes in FACS-sorted CD44−/CD24+ and CD44+/CD24− cells from four human primary NSCLC tumors. mRNA expression was quantified by SYBR-green-based RT-qPCR. Expression of an indicated mRNA in the CD44+/CD24− cells was calculated relative to its expression in CD44−/CD24+ cells from the respective tumor. Each dot represents mean ± SD of three replicates. See Figure 2—figure supplement 3B,C for details. (F) Schematic representation of the functional interactions between genes that we identified in the screen (green) and the HDR genes that we found to be downregulated (orange) in the H1650-M3 (and CD44+/CD24−) cells (see Supplementary file 2 for details). (G) The charts depict the percentage of viable cells 5 days after knockdown of the indicated genes relative to a scramble-siRNA control in the A549 cell line. Each bar represents mean ± SD of eight replicates from two independent experiments. See Figure 2—figure supplement 5 for knockdown efficiency (p-value *<0.05, **<0.005 paired t-test).

DOI: http://dx.doi.org/10.7554/eLife.21615.010

Figure 2.

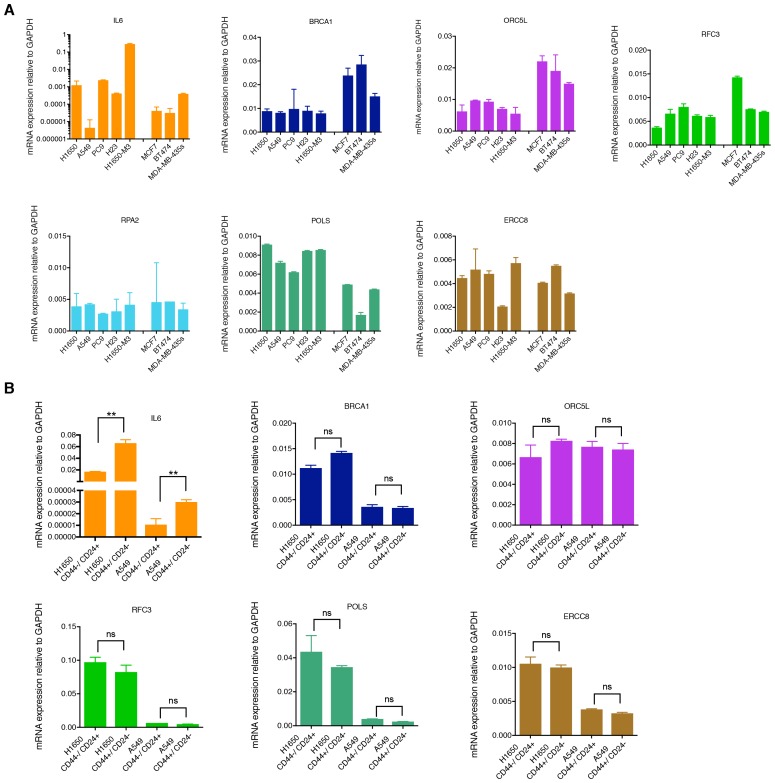
Figure 2—figure supplement 1. mRNA expression analysis of the shRNA screen hits in tumor-derived cell lines and cells that have been FACS sorted on the basis of their surface expression of CD44 and CD24.

Figure 2—figure supplement 1.

(A) mRNA expression analysis (SYBR-green-based RT-qPCR) of BRCA1, ORC5L, RFC3, RPA2, POLS and ERCC8 in tumor-derived cell lines. The data represent the mean ± SD of three replicates from two independent experiments. (B) mRNA expression analysis (SYBR-green-based RT-qPCR) of BRCA1, ORC5L, RFC3, RPA2, POLS and ERCC8 in H1650 and A549 that have been FACS sorted on the basis of their surface expression of CD44 and CD24. Each bar represents the mean ± SD of three replicates from two independent experiments and represents the mRNA expression of the indicated gene normalized to GAPDH expression of each cell line. p-value **<0.005, unpaired t-test; ns= non-significant.
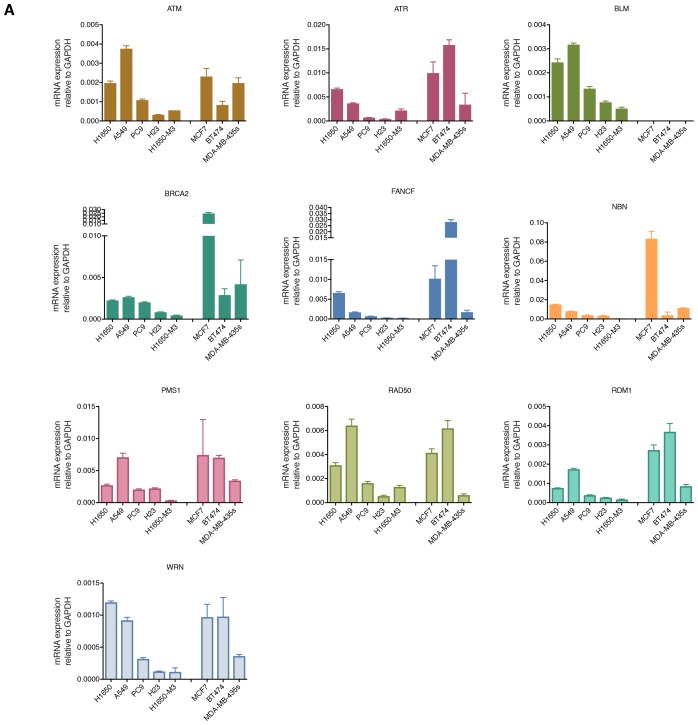
Figure 2—figure supplement 2. Differential mRNA expression of homology-directed repair (HDR) genes in multiple tumor-derived cell lines.

Figure 2—figure supplement 2.

The chart represents mRNA expression analysis (SYBR-green-based RT-qPCR) of the indicated HDR genes that we observed to be downregulated in the H1650-M3 (CD44+/CD24−) cells across the indicated cell lines. The data represent mean ± SD of three replicates from two independent experiments.
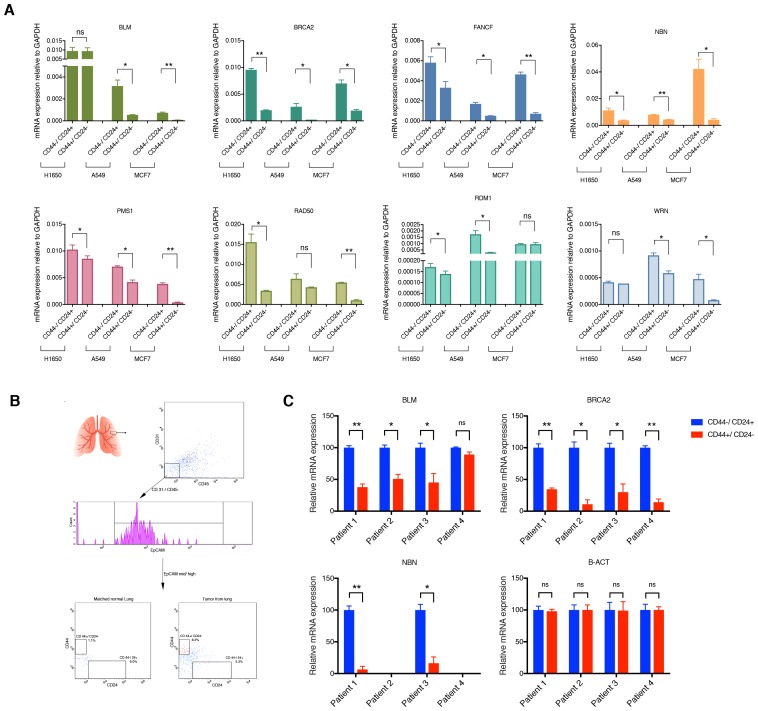
Figure 2—figure supplement 3. mRNA expression analysis of HDR genes in CD44−/CD24+ and CD44+/CD24− cells FACS sorted from cells lines and patient tumors.

Figure 2—figure supplement 3.

(A) Comparative expression of the indicated HDR genes in FACS-sorted CD44+/ CD24− cells relative to CD44−/ CD24+ cells from H1650, A549 and MCF7. mRNA expression was quantified by RT-qPCR. Each bar is the mean ± SD of three replicates from two different experiments and represents mRNA expression of the indicated gene. p-value *<0.05, **<0.005, unpaired t-test. (B) Schematic of cell sorting from tumors. Tumor-derived single cell suspension was stained with antibodies against CD45, CD31, EpCAM, CD44, and CD24. CD45-; CD31-; EpCAM+ cells were then FACS sorted according to the immune types CD44+/CD24− and CD44−/CD24+. (C) Expression of BLM, BRCA2, NBN and B-ACT genes in FACS sorted CD44−/CD24+ and CD44+/CD24− cells from four NSCL tumors. B-ACT was used as a housekeeping control gene. Each bar represents the mean ± SD of three replicates. p-value *<0.05, ***<0.0005, unpaired t-test.
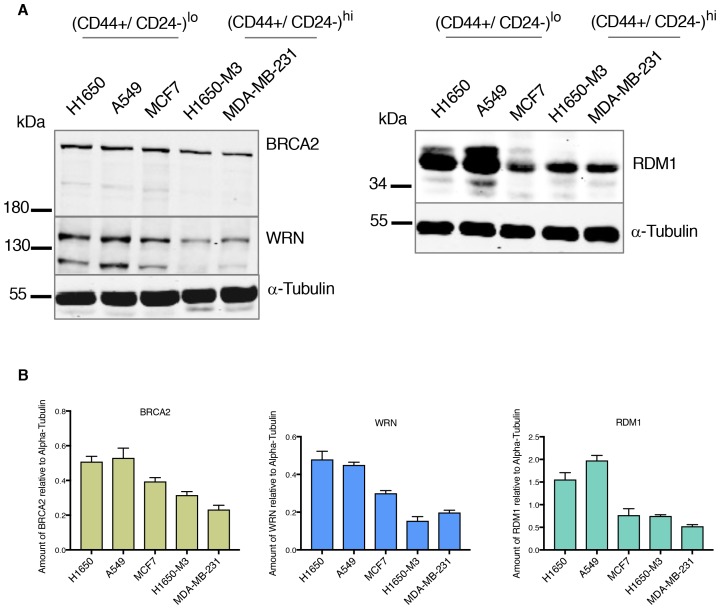
Figure 2—figure supplement 4. Differential expression of HDR genes in multiple tumor-derived cell lines at protein level.

Figure 2—figure supplement 4.

(A) Expression of BRCA2, WRN and RDM1 in multiple cancer-derived cell lines characterized by different CD44 CD24 immune types. α-Tubulin is used as a loading control. (B) The charts depict the quantification of relative amounts of BRCA2, WRN and RDM1. Levels of intensity of each band were quantified using imajeJ32 software and are represented as a ratio to α-tubulin. Each bar represents the mean ± SD from two independent experiments.
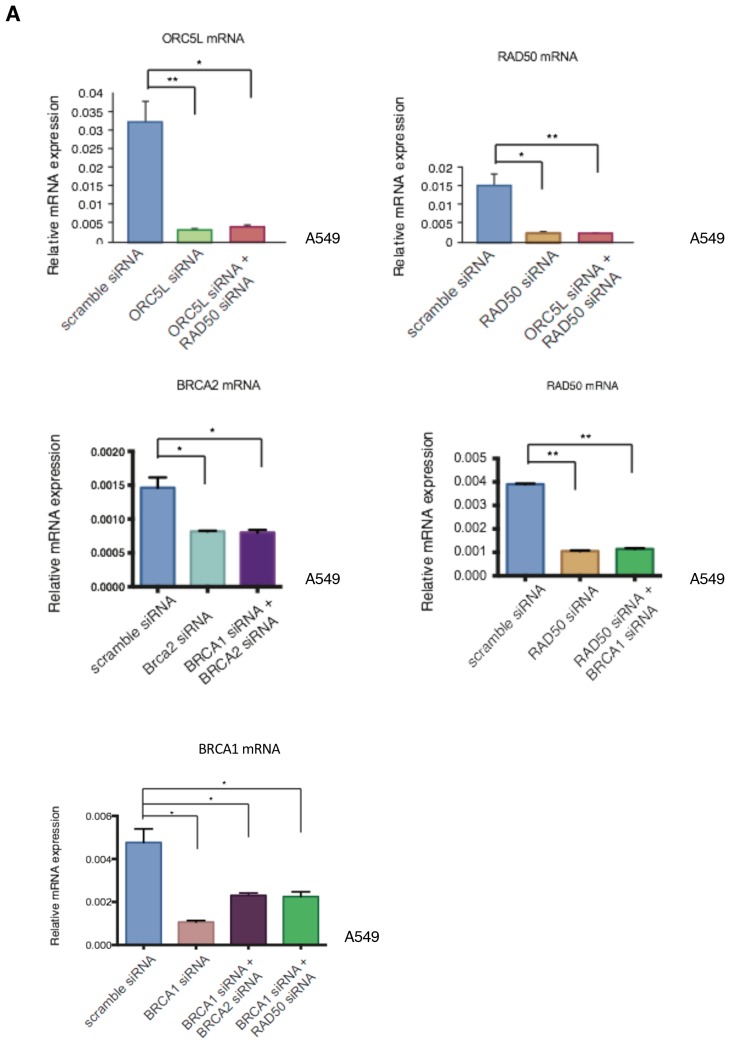
Figure 2—figure supplement 5. Knockdown efficiencies of the indicated siRNAs in A549 cells.

Figure 2—figure supplement 5.

Knockdown efficiency upon transfection with the indicated siRNA oligonucleotides and compared to scramble siRNA-transfected control cells. Cells were collected 3 days post transfection and analyzed for expression of the indicated mRNA. Each bar represents mean ± SD of three replicates from two independent experiments and represents mRNA expression of the indicated gene normalized to GAPDH expression of each cell line. p-value *<0.05, **<0.005, paired t-test.