. 2017 Jan 16;6:e21615. doi: 10.7554/eLife.21615

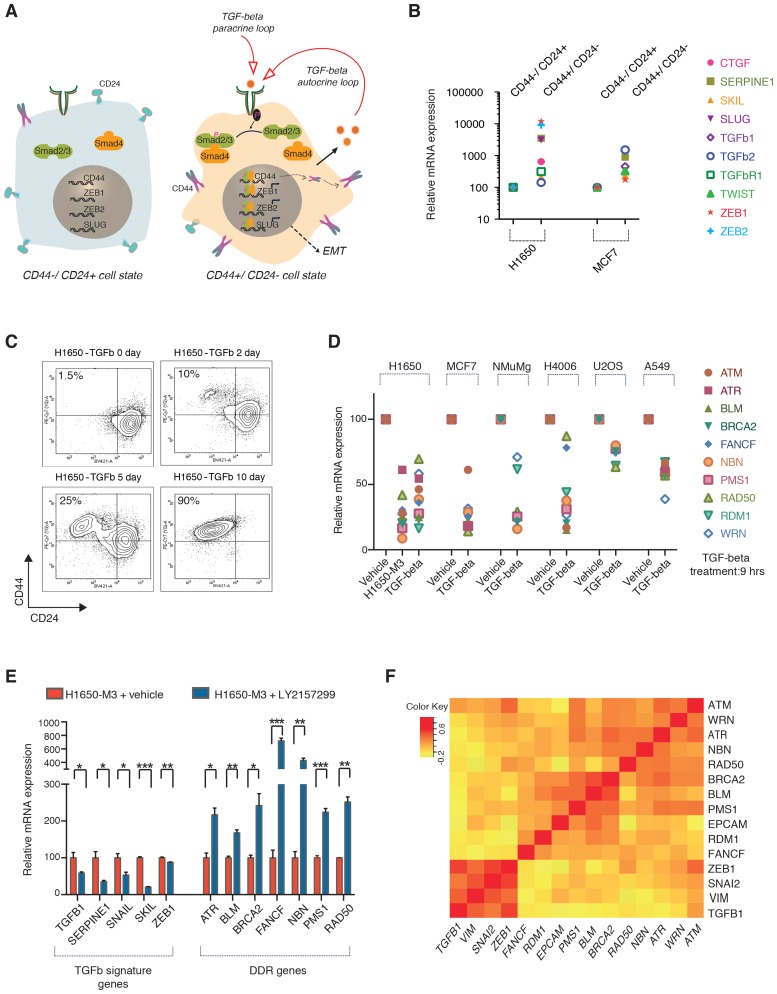
Figure 3. The TGF-β axis controls the expression of the HDR genes that are downregulated in CD44+/CD24− cells.

(A) TGF-β signaling is required for CD44+/CD24− cell state transition. The schematic provided here is based on current literature (Korkaya et al., 2011; Mani et al., 2008). (B) mRNA expression analysis of well-known TGF-β target genes in CD44+/CD24− cells relative to CD44−/ CD24+ cells FACS-sorted from H1650 and MCF7 cell lines. mRNA expression was quantified by SYBR-green-based RT-qPCR. Each dot represents the mean ± SD of three replicates from two independent experiments. See Figure 3—figure supplement 1 for details. (C) FACS analysis of H1650 cells exposed to TGF-β. Cells were treated with TGF-β for the indicated days and stained for the surface expression of CD44 and CD24 and analyzed by FACS. (D) mRNA expression analysis of the indicated HDR genes in TGF-β-treated cells relative to vehicle control across multiple tumor-derived cell lines. Cells were treated for 9 hr with TGF-β1 and TGF-β2 (1 ng/ml each). mRNA expression was quantified by SYBR-green-based RT-qPCR. Each dot represents the mean ± SD of three replicates from two independent experiments. See Figure 3—figure supplement 2B and Figure 3—figure supplement 3 for additional details. (E) The inhibition of TGF-β signaling in the CD44+/CD24− H1650-M3 cells results in an increased expression of HDR genes. TGF-β receptor 1 (TGFBR1) kinase activity was blocked by treatment with 20 μM of LY2157299 (Selleckchem) for 72–96 hr. Expression of TGF-β signature genes were used as a control for the efficacy of LY2157299 treatment. mRNA expression was quantified through SYBR-green-based RT-qPCR. Each bar represents the mean ± SD of three replicates from three independent experiments (p-value *<0.05, **<0.005 paired t-test). (F) Meta-analysis of human breast tumor dataset (BRCA) generated by the TCGA Research Network: http://cancergenome.nih.gov/. Average Pearson correlation coefficients (PCCs) between every pair of genes displayed were calculated and the matrix was generated. Pearson correlation coefficients ranged from −1 to +1. The matrix indicates an inverse co-regulation of the TGF-β1 and the HDR genes that we found to be downregulated in CD44+/CD24− cells.

DOI: http://dx.doi.org/10.7554/eLife.21615.016

Figure 3.

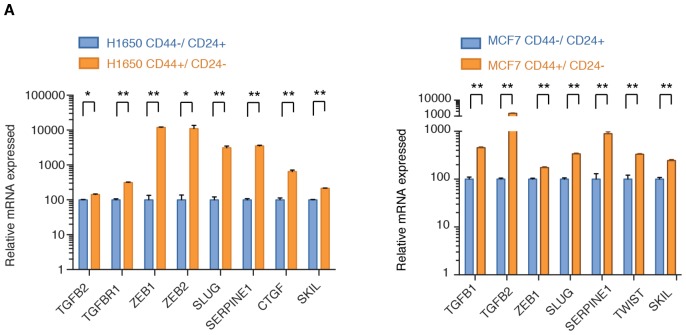
Figure 3—figure supplement 1. TGF-β signaling is upregulated in FACS-sorted CD44+/CD24− cells.

Figure 3—figure supplement 1.

Expression of well-known TGF-β target genes in CD44+/ CD24− cells relative to CD44−/ CD24+ cells sorted from H1650 and MCF7. mRNA expression was quantified by SYBR-green-based RT-qPCR. Each bar represents the mean ± SD of three replicates from two independent experiments and represents mRNA expression of the indicated gene normalized to GAPDH expression of each cell line (n = 6). p-value *<0.05, **<0.005 unpaired t-test.
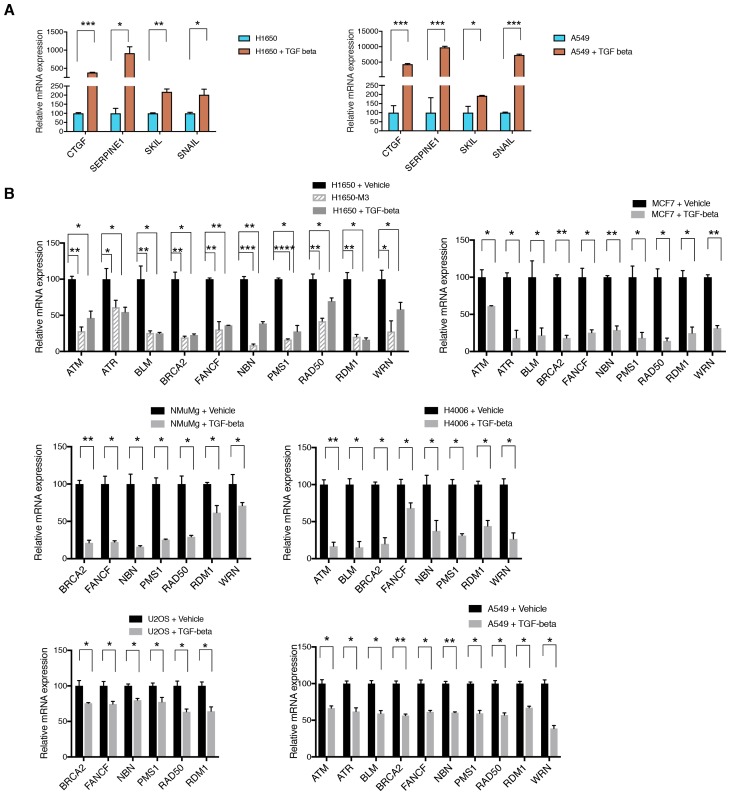
Figure 3—figure supplement 2. Active TGF-β signaling control the expression of multiple HDR genes.

Figure 3—figure supplement 2.

(A) TGF-β signature target genes measured by SYBR-green-based RT-qPCR in H1650 and A549 upon treating the cells with TGF-β for 9 hr. mRNA expression was quantified by RT-qPCR. Each bar represents the mean ± SD of three replicates from three independent experiments and represents mRNA expression of the indicated gene. p-value *<0.05, **<0.005 , ***<0.0005, paired t-test. (B) mRNA expression analysis of indicated HDR genes in TGF-β-treated cells relative to vehicle control in the indicated cell lines. mRNA expression was quantified by SYBR-green-based RT-qPCR. Each bar represents the mean ± SD of three replicates from two independent experiments (n = 6), normalized to respective GAPDH mRNA expression. Cells were treated for 9 hr with TGF-β (1 ng/ml each of TGF-β1 and TGF-β2). p-value *<0.05, **<0.005 ***<0.0005, paired t-test.
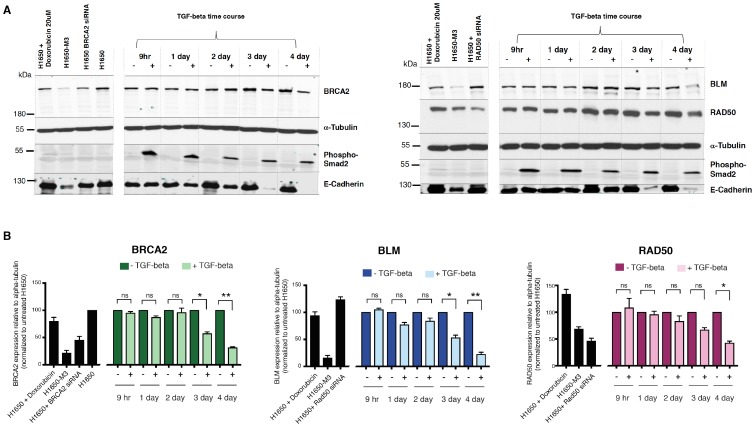
Figure 3—figure supplement 3. TGF-β signaling controls the expression of multiple HDR genes at the protein level.

Figure 3—figure supplement 3.

(A) Western blot analysis of the expression of BRCA2, BLM and RAD50 upon vehicle or TGF-β treatment (9 hr, 1 day, 2 day, 3 day or 4 day) in H1650 cells. Phospho-Smad2 and E-cadherin are used as a marker of active TGF-β signaling and MET, respectively. α-Tubulin is used as a loading control. (B) The charts depict the quantification of the relative amounts of BRCA2, BLM and RAD50. Levels of intensity of each band were quantified using imajeJ32 software, represented as a ratio of the protein of interest to α-tubulin, and normalized to levels detected in respective TGF-β untreated (–TGF-β) samples. The data represent the mean ± SD from two independent experiments. p-value *<0.005, ***<0.001, unpaired t-test with Welch’s correction.
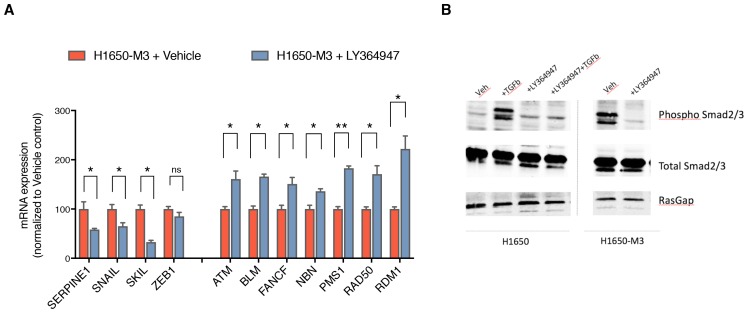
Figure 3—figure supplement 4. Inhibition of TGF-β signaling in the CD44+/CD24− H1650-M3 cells results in an increased expression of HDR genes.

Figure 3—figure supplement 4.

(A) TGF-β receptor 1 (TGFBR1) kinase activity was blocked by treatment with 1 uM LY364947 (Selleckchem) for 48–72 hr. Expression of TGF-β signature genes were used as a control for the efficacy of LY364947 treatment. mRNA expression was quantified through SYBR-green-based RT-qPCR. Each bar represents the mean ± SD of three replicates from two independent experiments (p-value *<0.05, **<0.005 paired t-test). (B) Western blot analysis of H1650 and H1650-M3 cells treated with LY364947 (1 uM) shows that the inhibitor specifically inhibits TGF-β signaling, as phosphorylation of Smad2 and Smad3 are repressed after 48 hr of treatment.
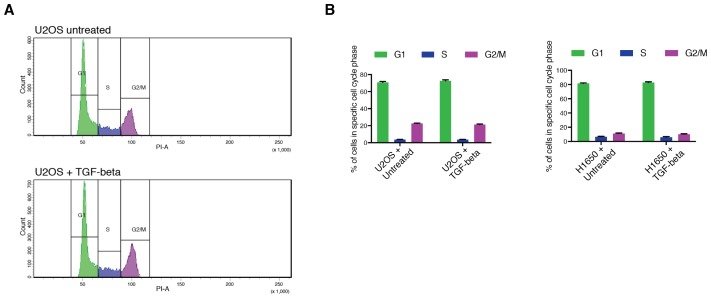
Figure 3—figure supplement 5. Exposure to TGF-β does not alter the cell cycle distribution in cancer cell lines.

Figure 3—figure supplement 5.

(A) TGF-β treatment does not alter the cell cycle distribution in U2OS cells. The histograms represent U2OS cell cycle distribution without or with TGF-β (1 ng/ml of each of TGF-β1 and TGF-β2, 9 hr). 10,000 cells were analyzed by FACS for each replicate of each sample. (B) Quantification of cell cycle distribution from U2OS and H1650 cells upon 9 hr treatment with TGF-β (1 ng/ml of each of TGF-β1 and TGF-β2). Each bar represents the mean ± SD of three replicates from two independent experiments.