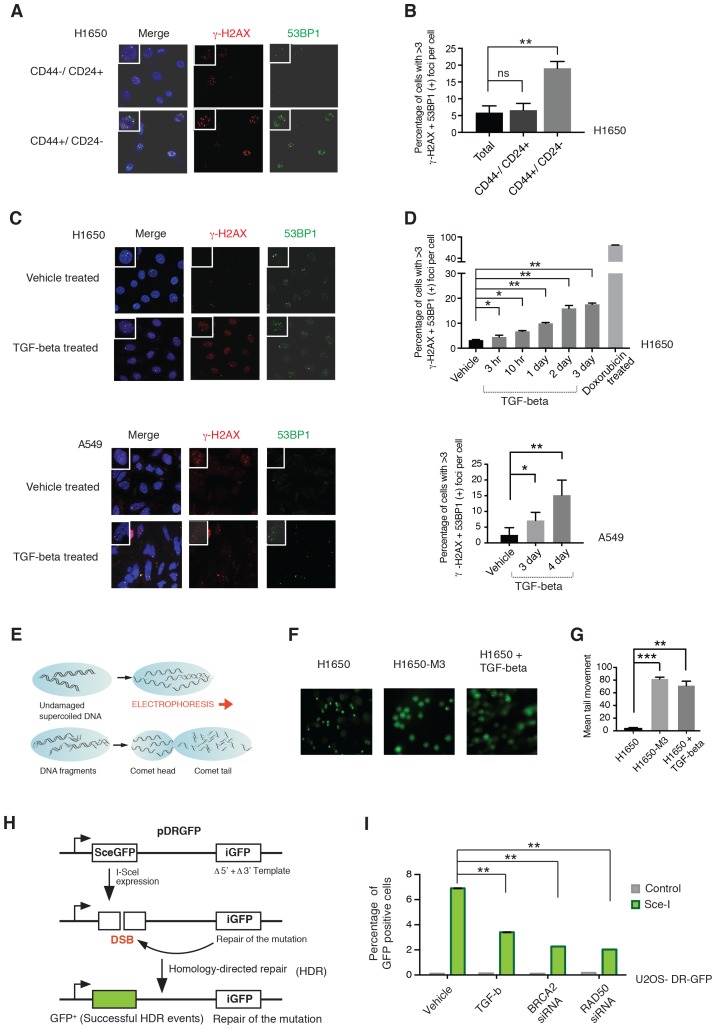
Figure 4. CD44+/CD24− cells are characterized by defect in DNA damage repair.
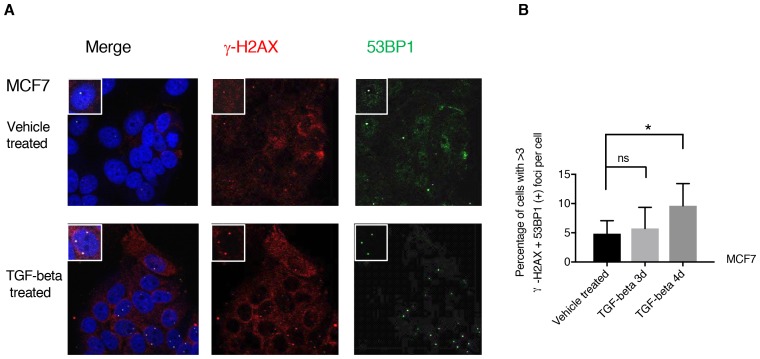
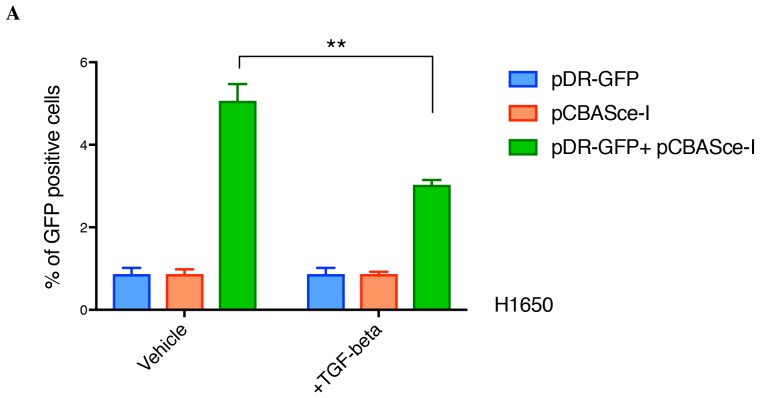
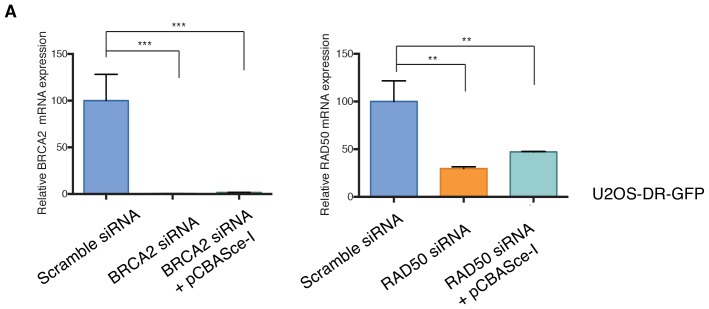
(A) CD44+/CD24− cells are characterized by increased DNA DSBs compared with CD44−/CD24+ cells. CD44+/CD24− and CD44−/CD24+ cells sorted from H1650 were stained with antibodies against γ-H2AX (red) and 53BP1 (green). DAPI (blue) was used as a counter-stain. Insets in the left upper corner show a representative nucleus. (B) The chart represents quantification of the experiment depicted in (A). Each bar represents the mean ± SD of the percentage of cells with more than three γ-H2AX and 53BP1 double-positive foci per field in CD44−/CD24+ cells and CD44+/CD24− cells, FACS-sorted from the H1650 cell line. Approximately ten fields were counted, for a total of 100 cells (n = 100) (p-value **<0.005, unpaired t-test). (C) H1650 and A549 cells treated with vehicle (DMSO) or TGF-β (1 ng/ml of each of TGF-β1 and -β2, for 4 days) were stained with antibodies against γ-H2AX (red) and 53BP1 (green). DAPI (blue) was used as a counter-stain. Insets in the left upper corner show a representative nucleus staining; analysis of an additional cell line is provided in Figure 4—figure supplement 1. (D) The chart represents quantification of the experiment depicted in (C). Each bar represents the mean ± SD of the percentage of cells with more than three γ-H2AX and 53BP1 double-positive foci per field in vehicle or TGF-β treated cells. Approximately ten fields were counted, for a total of 100 cells (n = 100). (p-value *<0.05, **<0.005, paired t-test). Doxorubicin treatment (10 μM for 24 hr) was used as a positive control. (E) Schematic of Comet assay. (F) Comet assay in H1650, H1650-M3 (CD44+/CD24−) and TGF-β-treated H1650 cells (treatment for 5 days), showing increased DNA strand breaks. (G) The chart represents quantification of the mean ± SD of tail movement of the samples depicted in (F), conducted in three replicates in two independent experiments. (p-value **<0.005, ***<0.0005, unpaired t-test). (H) Schematic of the DR-GFP assay. (I) The chart indicates the percentage of GFP-positive cells upon transfection with pCBASce-I (expressing Sce-I endonuclease) compared with control cells (untransfected cells). siRNA-mediated knock-down of RAD50 and BRCA2 was used as a homologous recombination (HR) efficiency control. Each bar represents mean ± SD of three replicates from two independent experiments (n = 6) (p-value **<0.0005, paired t-test). See Figure 4—figure supplement 3 for knockdown efficiencies with the indicated siRNAs.


