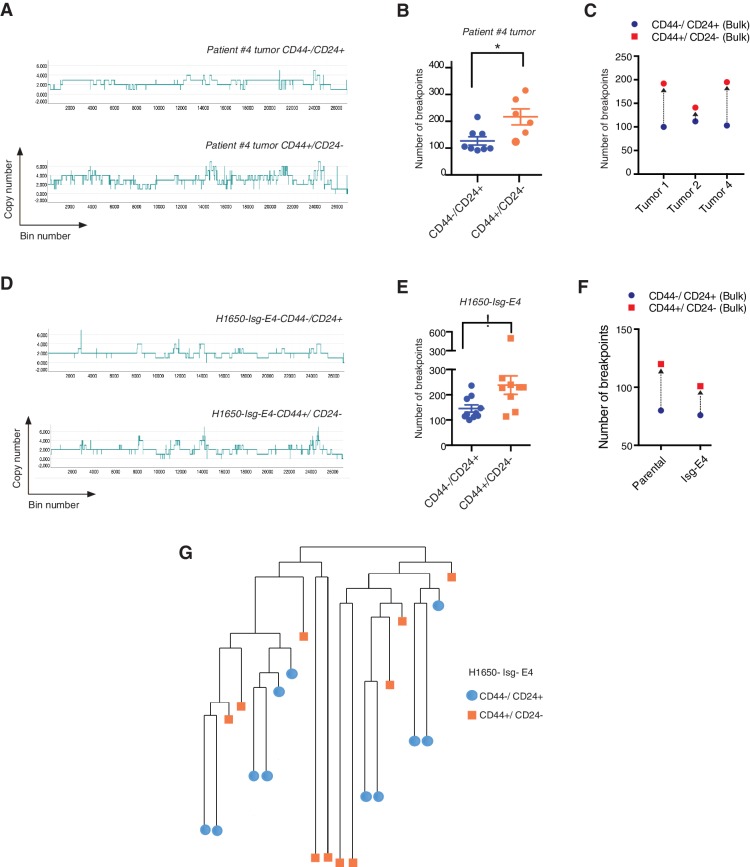
Figure 5. CD44+/CD24− cells have higher copy number alterations and increased genetic diversity.
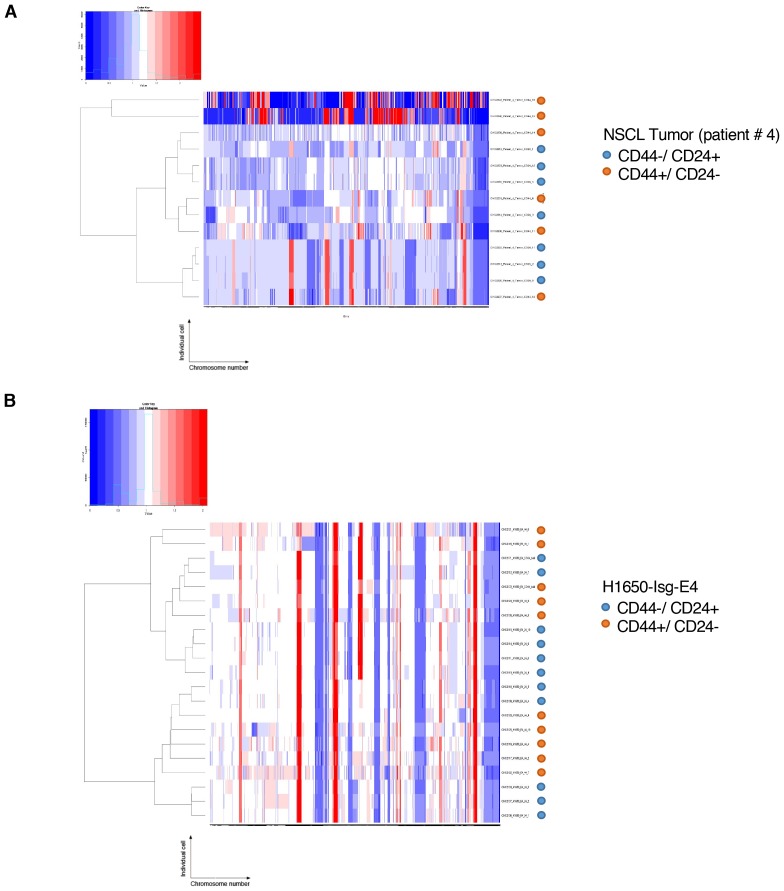
(A) The graph illustrates a representative copy number profile of CD44−/CD24+ cells and CD44+/CD24− cells sorted from an NSCLC patient (Patient #4). The x-axis corresponds to bins across the genome space from chr1 on the left to the sex chromosomes on the right. The y-axis corresponds to the copy number value at each bin. (B) The chart represents the number of DNA joint points in FACS-sorted CD44−/CD24+ cells (blue circle) and CD44+/CD24− cells (orange circle) from the indicated human NSCLC tumor. Each dot represents the analysis of a single cell. The breakpoint matrix (utilized to calculate DNA joint points), cluster dendogram and heat-map of normalized read counts (Figure 5—figure supplement 1A) were generated using Ginkgo, an open-source web platform for interactive analyses of CNA. (Garvin et al., 2015) (http://qb.cshl.edu/ginkgo). A variable bin size of 175 kb is used. p-value * < 0.05, unpaired t-test with Welch’s correction. Error bars indicate standard deviation. (C) The chart represents number of DNA joint points in CD44−/CD24+ (blue circle) and CD44+/CD24− (red circle) cells FACS-sorted from the indicated primary human NSCLC. Each dot represents the analysis of a cell type collected and sequenced in bulk. (D) The graph illustrates a representative copy number profile of one CD44−/CD24+ and one CD44+/CD24− FACS-sorted cell from the H1650-derived isogenic cell line H1650-Isg-E4. (E) The chart represents the number of DNA joint points in FACS-sorted CD44−/CD24+ cells (blue circle) and CD44+/CD24− cells (orange squares) from the H1650-Isg-E4 cell line. Each dot represents the analysis of a single cell. The breakpoint matrix (utilized to calculate DNA joint points) is generated along with the cluster dendogram and heat-map of normalized read-counts (Figure 5—figure supplement 1B) using Ginkgo. A variable bin size of 175 kb is used. p-value *<0.05, unpaired t-test with Welch’s correction. Error bars indicate standard deviation. (F) The chart depicts the number of DNA joint points in CD44−/CD24+ (blue circle) and CD44+/CD24− (red square) cells FACS-sorted from the H1650 (parental) and H1650 isogenic Isg-E4 cell lines. Each dot represents the analysis of a cell type collected and sequenced in bulk. (G) Cluster dendogram of normalized read-counts across segment breakpoints (using Euclidian distance and the ward-clustering method) of CD44−/CD24+ cells (blue circle) and CD44+/CD24− cells (orange squares) FACS-sorted from the H1650-Isg-E4 cell line. Each dot represents a single cell. The cluster dendogram is generated with Ginkgo.


