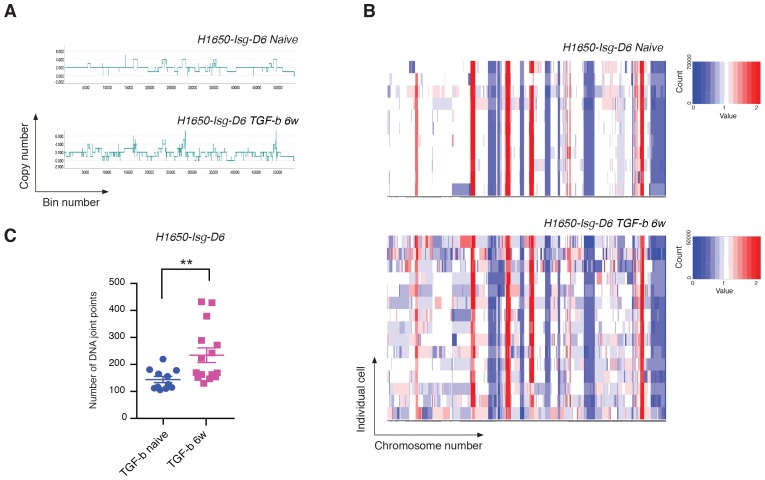
Figure 6. Exposure to TGF-β is sufficient to increase CNA and genetic diversity of the cell population.
(A) The graph illustrates a representative copy-number profile of one TGF-β-naïve cell and one TGF-β-treated (TGF-b 6w) cells from the H1650 isogenic/single cell-derived cell line Isg-D6. H1650-Isg-D6 was treated with vehicle (DMSO) or TGF-β (1 ng/ml of each of TGF-β1 and -β2) for six weeks. Single cell CNA analysis was performed upon TGF-β withdrawal. The x-axis corresponds to bins across the genome space from chr1 on the left to the sex chromosomes on the right. The y-axis corresponds to the copy number value at each bin. (B) Heat map of normalized read counts of TGF-β-naïve and TGF-β-treated (TGF-b 6w) cells from the H1650-Isg-D6 cell line, across segment breakpoints with a variable bin size of 50 kb (using Euclidian distance and the ward clustering method). Each horizontal line across the y-axis represents an individual cell, whereas the x-axis annotates the CNA across chromosomes from chr1 on the left to the sex chromosomes on the right. (C) The chart represents the number of DNA joint points in TGF-β-naïve (blue circle) and TGF-b 6w (purple squares) cells from the H1650-Isg-D6 cell line. Each dot represents the analysis of a single cell. The breakpoint matrix (utilized to calculate DNA joint points) is generated along with the cluster dendogram and heat-map of normalized read-counts (as shown in (B)) using Ginkgo with a variable bin size of 50 kb (http://qb.cshl.edu/ginkgo). p-value **=0.0064, unpaired t-test with Welch’s correction.

