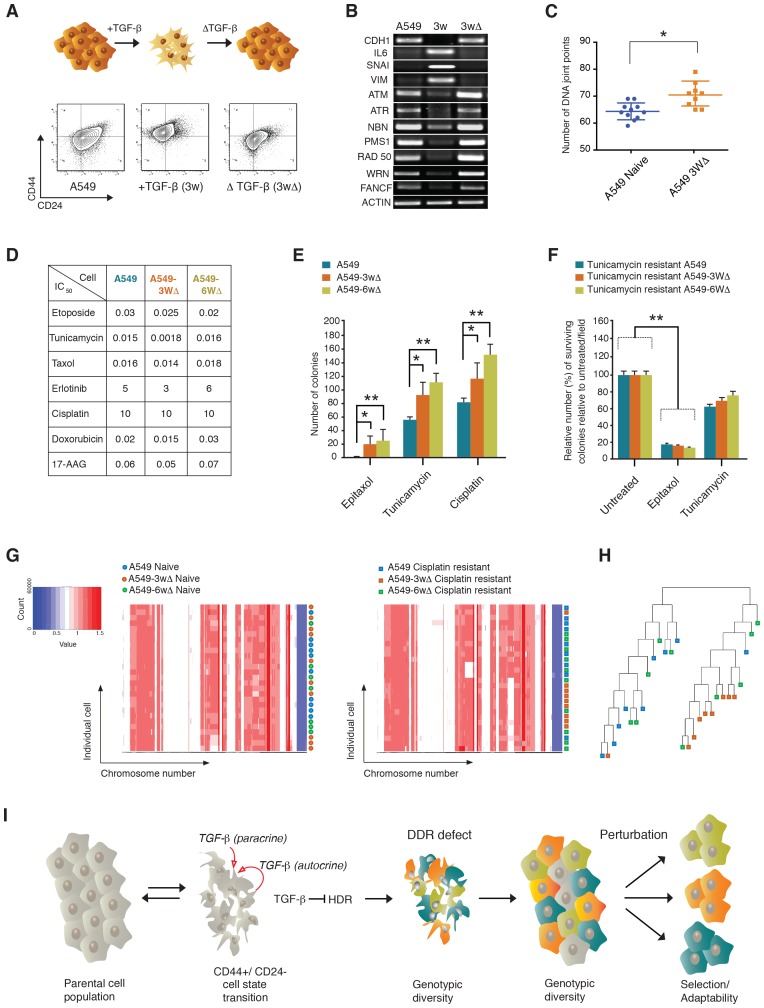
Figure 7. The TGF-β-induced CD44+/CD24− cell state increases the adaptability of cell populations.
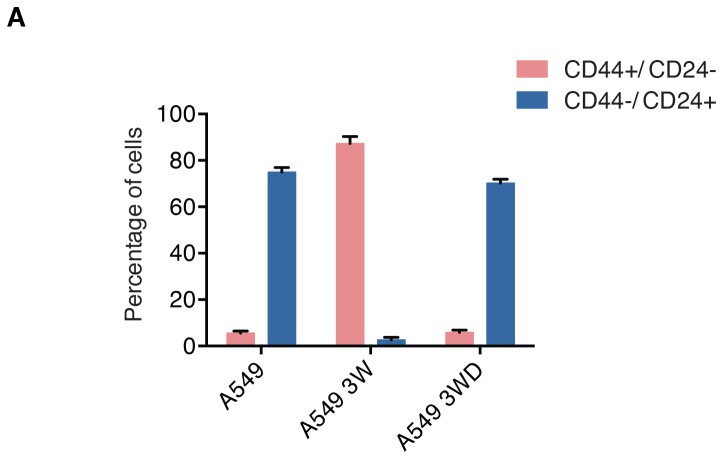
(A and B) A549 cells exposed to TGF-β acquire phenotypic and molecular changes characteristic of a CD44+/CD24− cell state. Upon TGF-β withdrawal, the cells return to their original cell state, as indicated by the FACS analysis in (A) and the RT-PCR analysis in (B). See Figure 7—figure supplement 1 for quantification of FACS analysis. (C) The chart indicates the number of DNA joint points in TGF-β-naïve and TGF-β-treated A549 cells. Each dot represents the analysis of a single cell. The breakpoint matrix (utilized to calculate DNA joint points) is generated using Ginkgo (http://qb.cshl.edu/ginkgo). A variable bin size of 175 kb is used. p-value *<0.05, unpaired t-test. (D) The table depicts the IC50 values of A549, A549-3W△ and A549-6W△ cells in the context of treatment with the indicated drugs. (E and F) TGF-β treatment increased the adaptability of cells. Cells that were transiently exposed to TGF-β for 3 or 6 weeks (A549-3W△, A549-6W△) were then treated with the indicated drugs upon TGF-β withdrawl. (E) The number of colonies (mean ± SD) that have survived epitaxol (1.6 μM), tunicamycin (3.2 μM) and cisplatin (1 mM) treatment. Notably, the concentration of drugs used in this experiment corresponds to approximately >100X the IC50. Two independent experiments, each with three replicates, were carried out and approximately 50 fields were counted for each sample. (p-value *<0.05, **<0.005, paired t-test.) (F) A549 tunicamycin-resistant clones were grown in regular/drug-free medium for a week and then retested for sensitivity to tunicamycin (3.2 μM) or epitaxol (1.6 μM). The plot represents mean ± SD number of colonies surviving 5 days after treatment compared with untreated cells, from two independent experiments each with three replicates (p-value **<0.005, paired t-test). (G) Heat map of normalized read counts across segment breakpoints (using Euclidian distance and the ward-clustering method) of the indicated cells. Each horizontal line across the y-axis represents an individual cell, whereas the x-axis annotates the CNA across chromosomes from chr1 on the left to the sex chromosomes on the right. A heat map of cisplatin-naïve cells is shown on the left and of cisplatin-resistant cells on the right. (H) Cluster dendogram of normalized read counts across segment breakpoints (using Euclidian distance and the ward-clustering method) of cisplatin-resistant-A549, cisplatin-resistant-A549-3W△ and cisplatin-resistant-A549-6w△. The cluster dendogram and heat-map of normalized read counts were generated using Ginkgo. (I) Schematic of proposed model. When cells transit into a CD44+/CD24− state, they acquire mesenchymal-like features and autocrine secretion of TGF-β that leads to the downregulation of HDR genes. This process results in a hyper-mutable phenotype that spurs genetic diversity and intra-tumor clonal heterogeneity. Consequently, following a Darwinian model of cancer evolution, the transition of cancer cells into a CD44+/CD24− state or exposure to TGF-β leads to an increased adaptability to any given perturbation.


