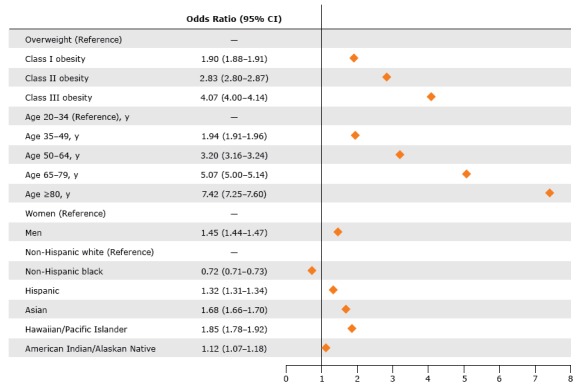
Figure.

Multivariable adjusted probability of having 1 or more cardiometabolic risk factors among adults (aged ≥20 y) with overweight or obesity but not diabetes, Patient Outcomes Research to Advance Learning (PORTAL), 2012-2013. Because of the large sample size, 95% confidence intervals were narrow and cannot be depicted in the graphic. The logistic model equation was Y = −1.44 + 0.66 (Age Category 1) + 1.16 (Age Category 2) + 1.62 (Age Category 3) + 2.00 (Age Category 4) + 0.37 (Male) + 0.52 (Asian) – 0.33 (non-Hispanic black) + 0.28 (Hispanic) + 0.12 (American Indian/Alaskan Native) + 0.61 (Hawaiian/Pacific Islander) + 1.04 (Weight Category 1) + 1.40 (Weight Category 2) + 0.64 (Weight Category 3). The probability calculates as Probability(Outcome) = [exp(Y)]/(1+ exp(Y).
| Variable | Odds Ratio (95% Confidence Interval) |
|---|---|
| Weight | |
| Overweight | 1.00 [Reference] |
| Class I obesity | 1.90 (1.88−1.91) |
| Class II obesity | 2.83 (2.80−2.87) |
| Class III obesity | 4.07 (4.00−4.14) |
| Age, y | |
| 20–34 | 1.00 [Reference] |
| 35–49 | 1.94 (1.91−1.96) |
| 50–64 | 3.20 (3.16−3.24) |
| 65–79 | 5.07 (5.00−5.14) |
| ≥80 | 7.42 (7.25−7.60) |
| Sex | |
| Female | 1.00 [Reference] |
| Male | 1.45 (1.44−1.47) |
| Race/ethnicity | |
| Non-Hispanic white | 1.00 [Reference] |
| Non-Hispanic black | 0.72 (0.71−0.73) |
| Hispanic | 1.32 (1.31−1.34) |
| Asian | 1.68 (1.66−1.70) |
| Hawaiian/Pacific Islander | 1.85 (1.78−1.92) |
| American Indian/Alaskan Native | 1.12 (1.07−1.18) |
