
Figure 11.
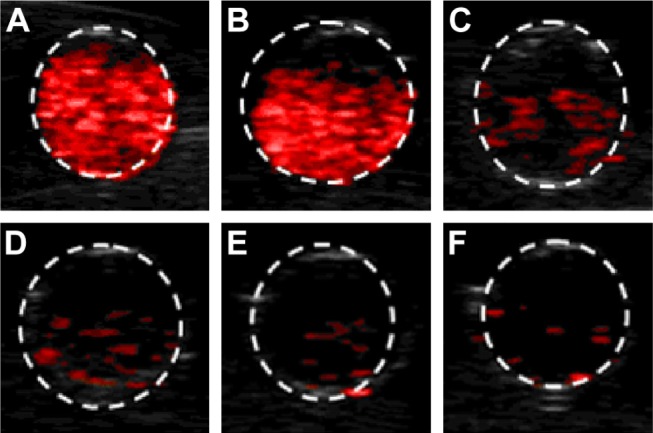
Concentration of ammonium bicarbonate-encapsulating nanoparticles versus photoacoustic signal images.
Notes: Photoacoustic signal intensity serially decreased with decreasing concentration. (A) The original concentration. (B) The 2-fold diluted concentration. (C) The 4-fold diluted concentration. (D) The 8-fold diluted concentration. (E) The 16-fold diluted concentration. (F) The 32-fold diluted concentration. The positive result is represented within the dotted lines.