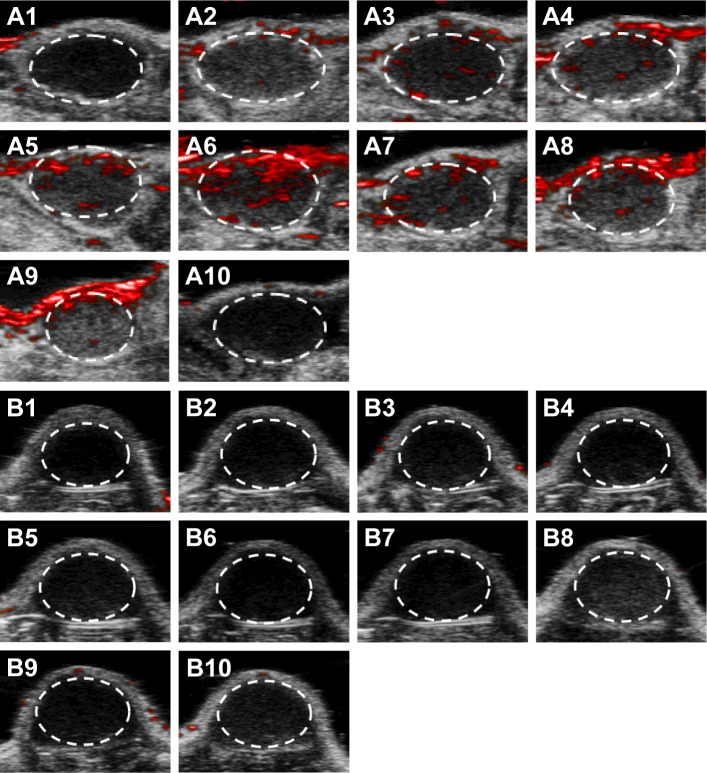
Figure 15.
Photoacoustic images of subcutaneous tumor in each group.
Notes: Treatment group recorded photoacoustic signal with time. Control group recorded no photoacoustic signal with time. (A1–A10) Treatment group (A1: before injection, A2–A10: 30 min, 1, 2, 3, 4, 5, 6, 12, and 24 h after injection, respectively). (B1–B10) Control group (B1: before injection, B2–B10: 30 min, 1, 2, 3, 4, 5, 6, 12, and 24 h after injection, respectively). The positive result is represented within the dotted lines.

