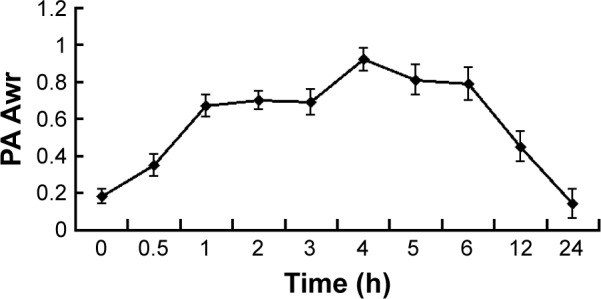
Figure 16.

Time of irradiating subcutaneous tumors for the treatment group versus photoacoustic signal intensity.
Note: The photoacoustic signal value increases gradually with time and then lowers gradually.

Time of irradiating subcutaneous tumors for the treatment group versus photoacoustic signal intensity.
Note: The photoacoustic signal value increases gradually with time and then lowers gradually.