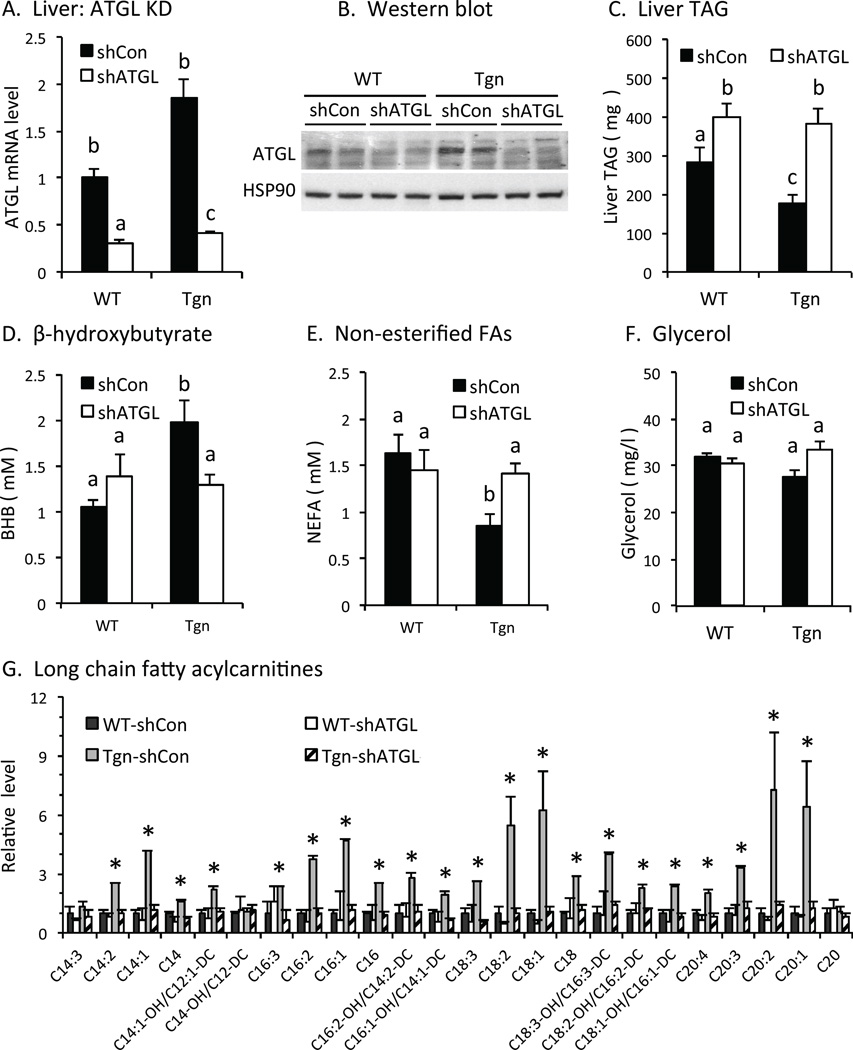
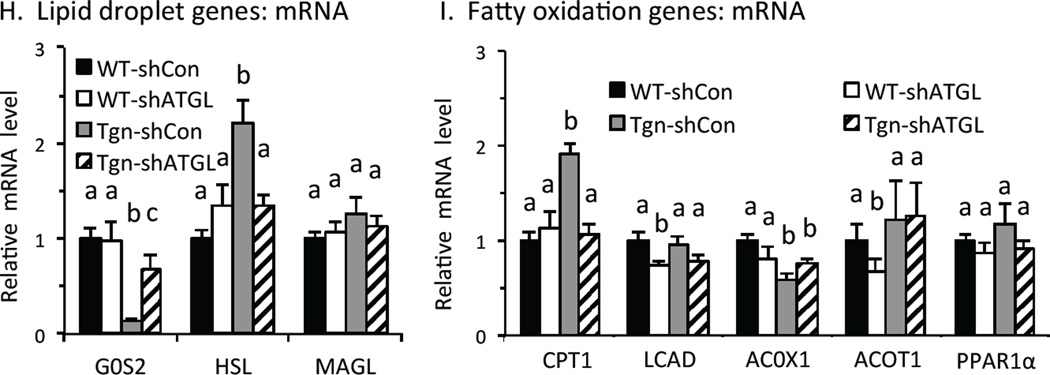
Fig. 3. TAG catabolism in liver.
A. ATGL knockdown in vivo. ATGL mRNA levels were measured in liver in wildtype (WT) and transgenic (Tgn) mice 7 d after tail vein injection with adenovirus expressing control/scrambled shRNA (shCON, solid bars) or ATGL shRNA (shATGL, open bars) or (n = 4–5). B. Western blot. ATGL protein level in liver from WT and Tgn mice w/wo ATGL KD. C. Liver TAG. TAG in refed WT and Tgn mice 7 d after ATGL KD (n = 4–5). D-F. Plasma levels of β-hydroxybutyrate (D), non-esterified fatty acids (E) and glycerol (F). Plasma was collected from briefly (4-hr) fasted mice from WT and Tgn mice 5 days after treatment with control (solid bar) or shATGL (open bar) adenovirus. Plasma BHB levels in 4-hr fasted WT and Tgn mice 5 d post ATGL KD (n = 6–8). G. Fatty acylcarnitines. Long chain fatty acyl carnitines in liver from refed WT and Tgn mice 7 d after treatment with adenovirus expressing scrambled/control or ATGL shRNA (n = 4–5). H. Lipid droplet genes. Relative level of G0S2, hormone sensitive lipase (HSL) and monoacylglycerol lipase (MAGL) mRNA in WT and Tgn mice 7d post ATGL shRNA or control adenovirus treatment (n = 4–5). I. Fatty acid oxidation genes. Carnitine palmitoyltransferase-1 (CPT-1), very long chain acyl-CoA dehydrogenase (LCAD), acyl-CoA oxidase (ACOX1), acyl-CoA thioesterase1 (ACOT1) and PPARα mRNA levels 7 d post treatment with ATGL shRNA or control adenovirus are shown (n = 4–5). Statistical significance (P<0.05) was determined by ANOVA, where bars with unlike letters differ, or Student’s t test (*). Mean + SEM.


