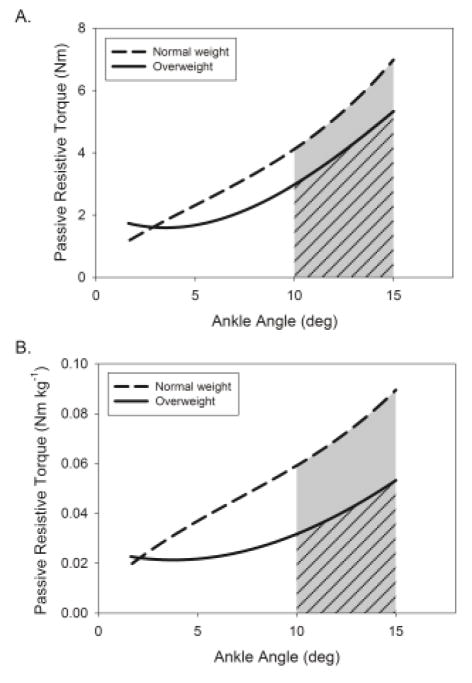
Figure 2.
Stress-strain curves of the ankle plantarflexors for the comparison of passive-elastic properties between normal weight (dashed) and overweight (solid) older adults in absolute terms (A) and per kilogram of body mass (B). Stiffness was determined as the slope of the angle-torque curve from 10 – 15 degrees of dorsiflexion and work absorption was determined as the area under the curve shown in the shaded region; diagonal lines identify the overweight group work absorption.

