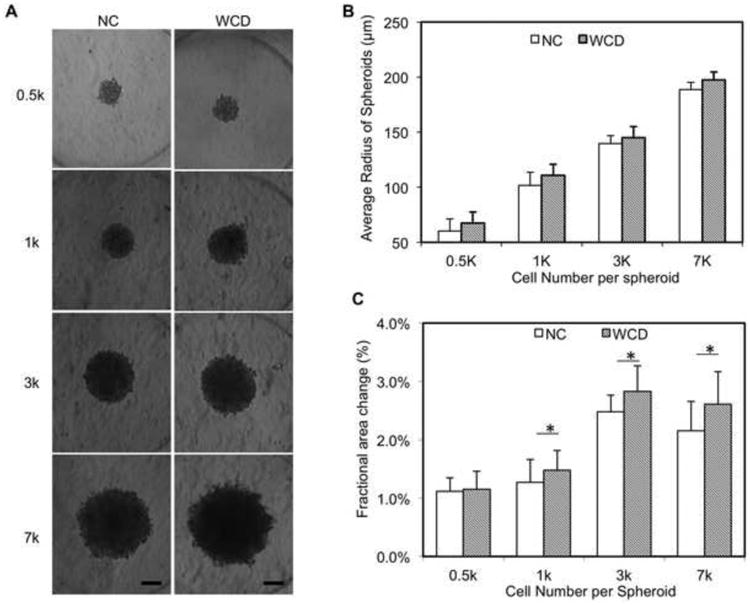
Figure 2. Human cardiac spheroids with controlled size and functional analysis.

(A) Bright field images of spheroids with different cell number (0.5k, 1k, 3k, 7k) per spheroid. (B) Averaged radius of spheroid based on statistics (n=14). (C) Average fractional area change from Day 1 to Day 7 of each group (n=7). NC – without e-SiNWs; WCD – with e-SiNWs. Scale bars: (A) = 100 μm. Asterisks (*) represent statistical significance with p<0.05; error bars represent standard deviation.
