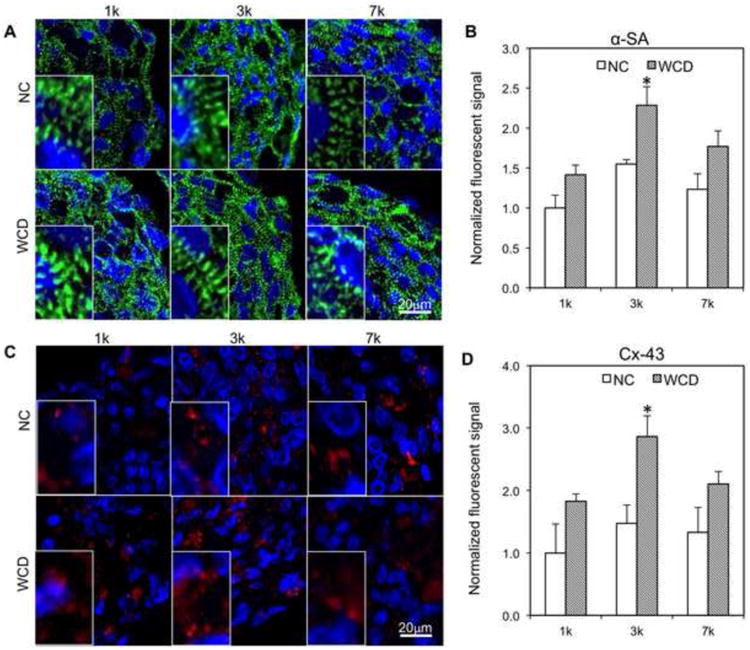
Figure 3. Histological analysis of spheroids.

(A-B) Immunofluorescent staining and quantification of cardiac-specific contractile proteins (α-SA) for all groups after 7 days cell culture. Blue – DAPI; Green – α-SA; NC – without e-SiNWs; WCD – with e-SiNWs. (C-D) Immunofluorescent staining and quantification of conductive proteins (Cx-43) for all groups after 7 days cell culture. Blue – DAPI; Red – Cx-43. NC – without e-SiNWs; WCD - with e-SiNWs. Fluorescent signal area per nuclei on cross section are normalized to the NC-1k condition (n=3; 75 μm × 130 μm picture regions, at least containing >50 nuclei). Error bars represent standard deviation. Scale bars: (A) = 20 μm; (C) = 20 μm. Asterisks (*) represent statistical significance between WCD3k and other groups with p<0.05
