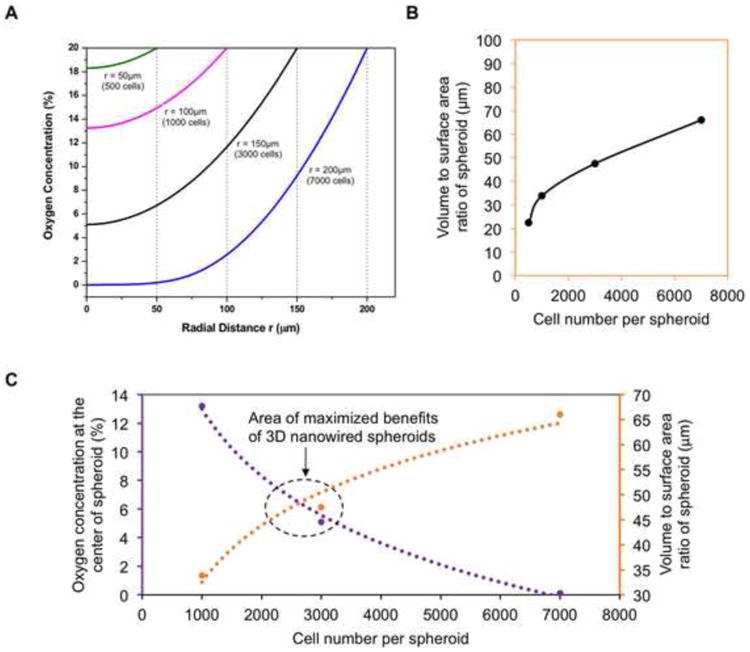
Figure 5. Functionally optimized range of cell number per spheroid.

(A) A mathematical model of oxygen percentage using rat neonatal cardiomyocyte data for oxygen consumption (ref. 29), showing the range of oxygen concentration throughout theoretical spheroids of different sizes. (B) The volume to surface area ratio of different sized spheroids represents the amount of 3D cell-cell interaction, as a larger volume to surface ratio indicates more cells inside the spheroid with higher chance of multi-dimensional cell-cell interaction. (C) Data points from oxygen percentage and spheroid volume to surface area ratio at the 1k, 3k, and 7k cells per spheroid can be combined to summarize our findings on the size with maximized benefits centered around 3k cells per spheroid.
