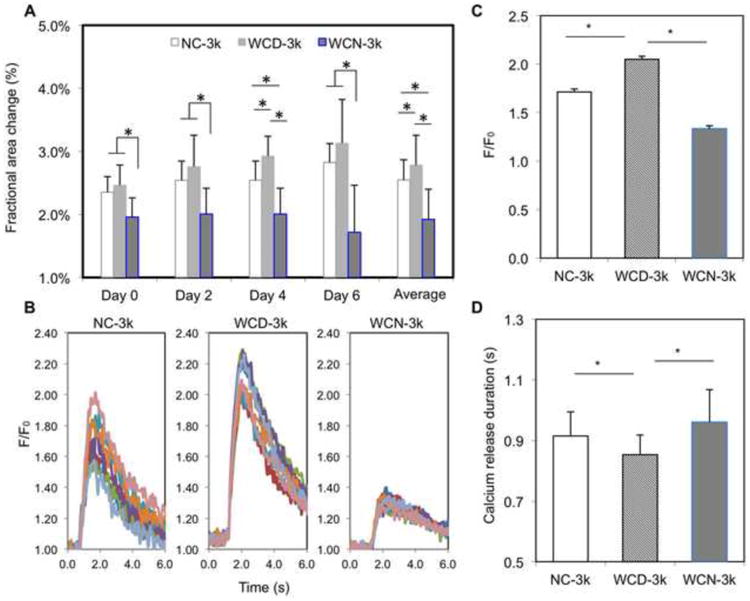
Figure 6. The effects of electrically conductivity of silicon nanowires on the function of 3k spheroids.

(A) Average fractional area change of NC-3k, WCD-3k and WCN-3k spheroids at Day 0, 2, 4, 6 and their averages (n=7). (B) Calcium transient of 7 regions of interest per spheroid for each group. Fluorescence amplitude, F/F0, refers to measured fluorescence intensity normalized to background fluorescence intensity. (C) Comparison of the peak value of F/F0 for each group (n=3). (D) Comparison of calcium release duration for each group (n=3). NC – without e-SiNWs; WCD – with doped SiNWs; WCN – with undoped SiNWs. Asterisks (*) represent statistical significance with p<0.05; error bar represents standard deviation.
