Figure 1.
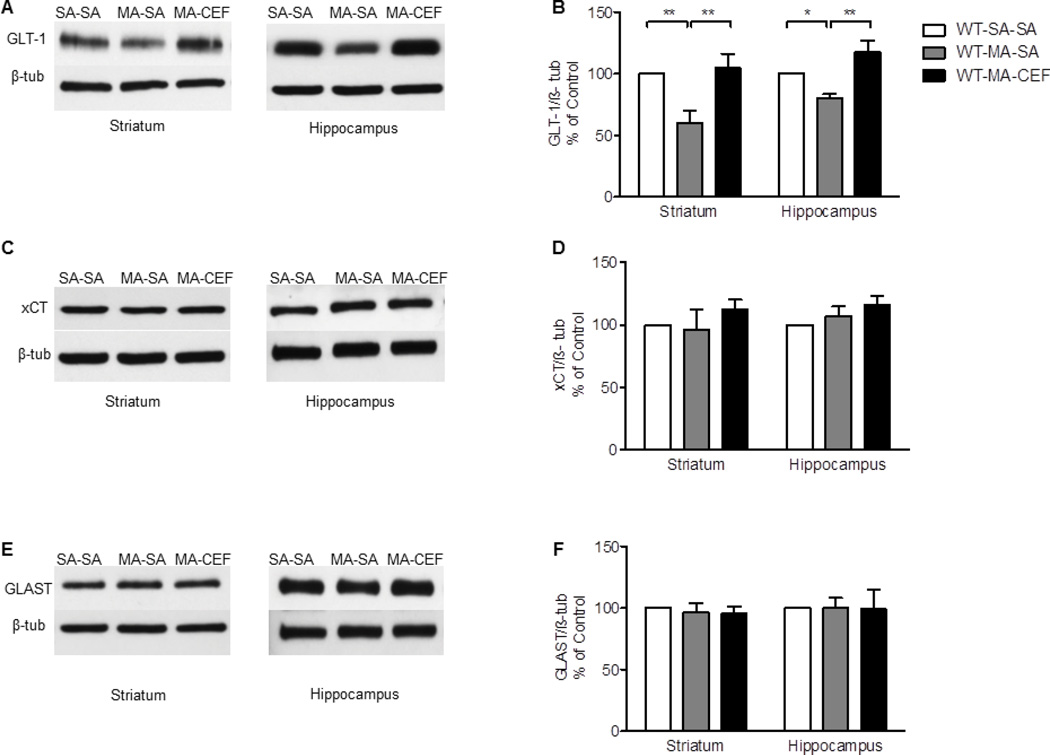
Effects of MA (10 mg/kg i.p. every 2 hrs ×4) and CEF (200 mg/kg) on GLT-1, xCT and GLAST expression in water groups in both striatum and hippocampus. (A, C, and E) Immunoblots for GLT-1, xCT and GLAST, respectively. (B) Quantitative analysis showed a significant increase in the ratio of GLT-1/β-tubulin in WT-MA-CEF groups compared to WT-MA-SA groups in striatum and hippocampus. Significant downregulation of GLT-1 expression was observed in WT-MA-SA groups compared to control WT-SA-SA groups in striatum and hippocampus. No significant difference in GLT-1 expression was found in WT-MA-CEF groups compared to WT-SA-SA group in both brain regions. (D) Quantitative analysis showed no significant difference in the ratio of xCT/β-tubulin between all tested groups in striatum and hippocampus. (F) Quantitative analysis showed no significant difference in the ratio of GLAST/β-tubulin between all tested groups in striatum and hippocampus. Values shown as means ± S.E.M (*p < 0.05 **p < 0.01) (n = 6 for each group).

