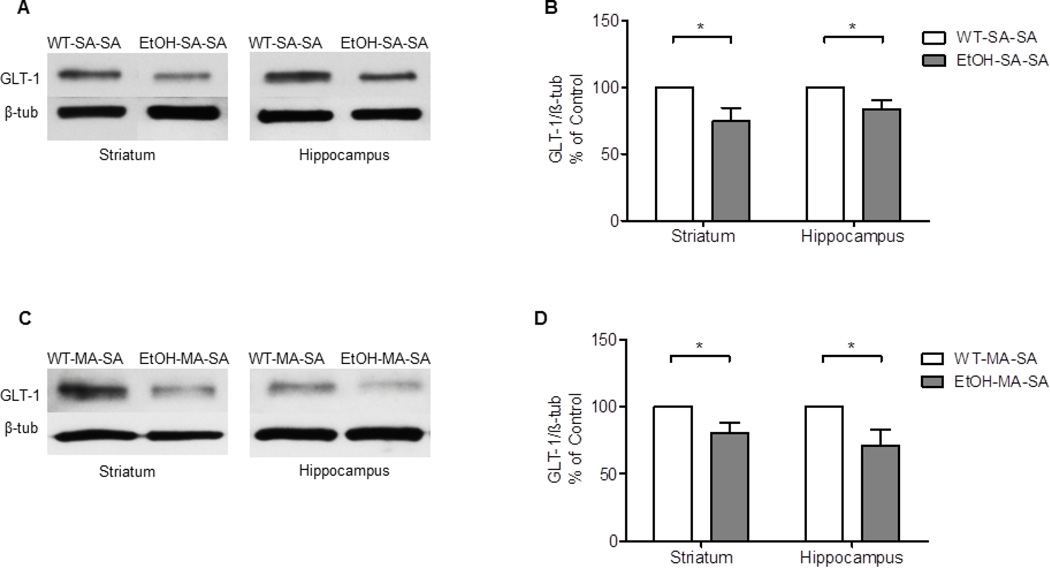
Figure 3.
Effects of MA (10 mg/kg i.p. every 2 hrs ×4) and EtOH (6 g/kg) on GLT-1 expression in striatum and hippocampus. (A, C) Immunoblots of GLT-1 in WT-SA-SA and EtOH-SA-SA groups as well as in WT-MA-SA and EtOH-MA-SA groups, respectively. (B) Quantitative analysis revealed a significant downregulation of GLT-1 expression in EtOH-SA-SA groups compared to WT-SA-SA groups in striatum and hippocampus, respectively. (D) Quantitative analysis revealed a significant downregulation of GLT-1 expression in EtOH-MA-SA groups compared to WT-MA-SA groups in striatum and hippocampus, respectively. Values shown as means ± S.E.M (*p < 0.05) (n = 6 for each group).

