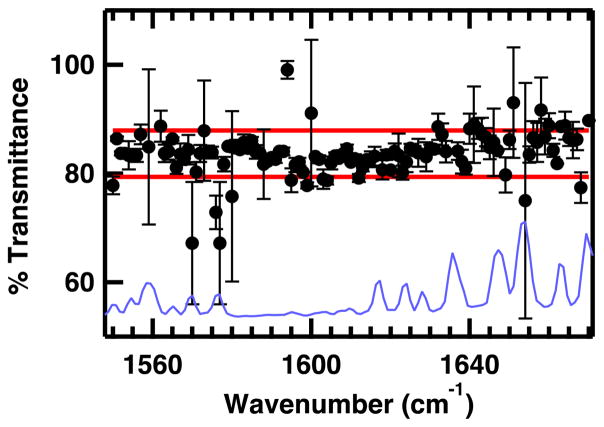
Figure 3.
Percent transmittance of the QCL probe beam through a 100 μM pinhole as a function of probe frequency. Error bars represent the standard deviation of three trials. Red lines represent one standard deviation from the average percent transmission through the pinhole. The FTIR absorbance spectrum of water vapor is overlaid for comparison (blue line, spectrum scaled for best comparison with QCL transmittance spectrum).

