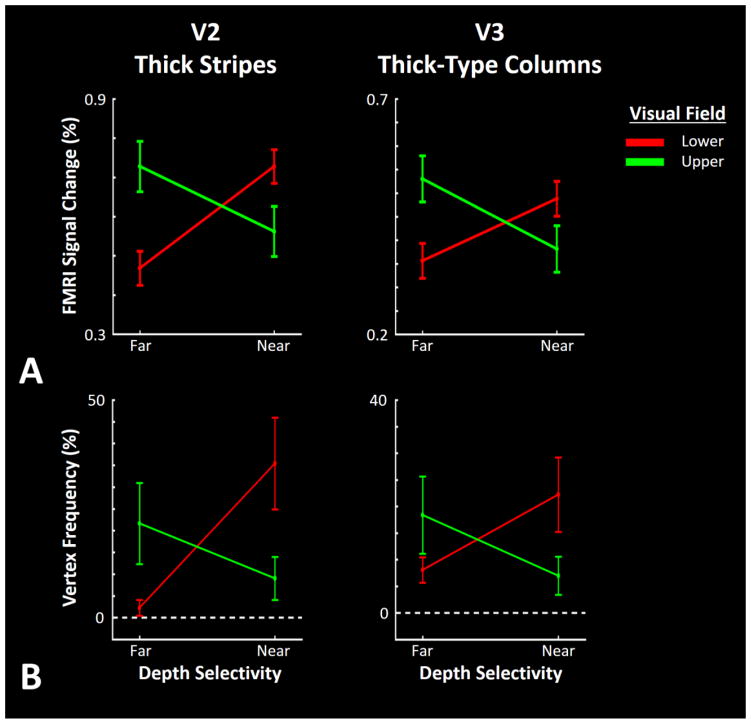
Figure 3.
Panel A shows the level of fMRI response evoked by far and near RDS, compared to activity evoked by RDS limited to the fixation plane. Consistent with the maps (Fig. 2), near and far stimuli evoked stronger activity in the portion of visual cortex that responds to lower and upper visual field stimulation, respectively. Panel B shows the frequency of vertices within V2 thick and V3 thick-type columns that showed a significant selective response to near and far RDS. All values are measured/normalized relative to the total number of vertices within the V2 thick and V3 thick-type columns. Error bars indicate one standard error of the mean.

