
Fig. 10.
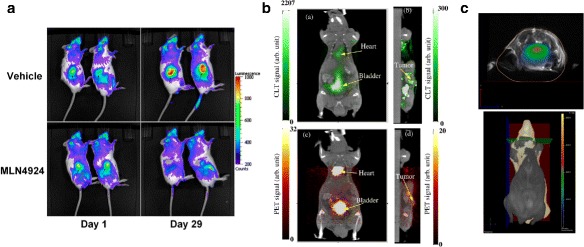
Examples of preclinical CLI and CLT. a Tumor treatment monitoring over time in a vehicle group and in a group treated with an anti-tumor agent [93] (with permission). b Reconstruction of the activity distribution with Cerenkov luminescence tomography (green, top) and with PET (red, bottom) as done by [96] (with permission). c Reconstructed msCLT trans-axial slice co-registered with MRI from [54] (with permission). The reconstructed slice position is highlighted in green in the bottom part of the figure