
Fig. 7.
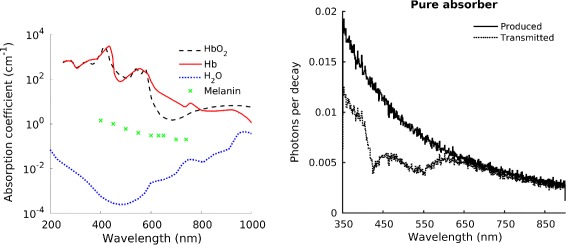
Left: Absorption spectra of tissue components. Data for both oxygenated and deoxygenated hemoglobin were taken from [44], water data by [45] and melanin data by [46]. Right: Monte Carlo simulation of the modification of the Cerenkov spectrum in 1 cm of a typical tissue-like pure absorber (dotted line), with the original Cerenkov emission spectrum as a reference