
Fig. 4.
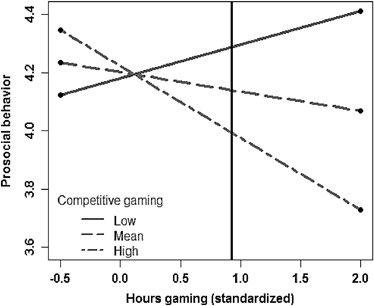
Interaction between competitive gaming and gaming frequency predicting changes in prosocial behavior. Values to the right of the vertical line represent cases where prosocial behavior differs across groups, and the vertical line marks children who reported playing 8.64 h per week. On the x-axis, −0.5 represents children who reported playing 2.87 h per week, 0 represents children who reported playing the mean number of hours per week (4.9)